
Hummingbird Technologies
Transforming the agriculture industry by providing advanced crop analytics derived from remote sensing imagery and machine learning algorithms.
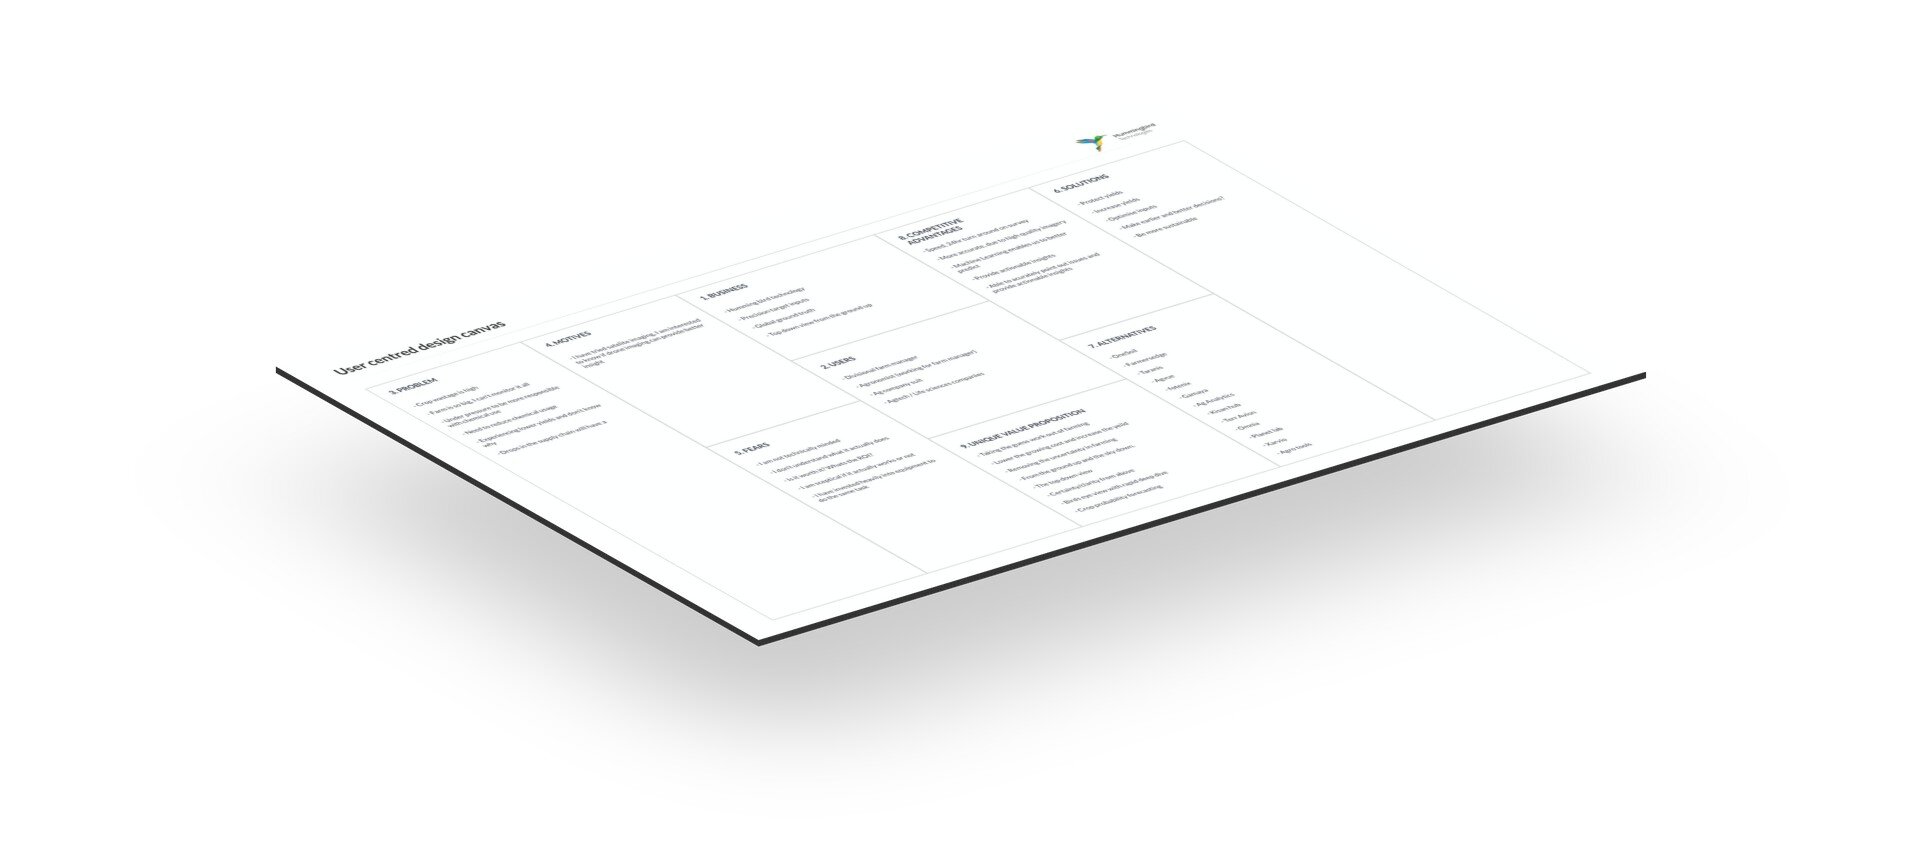
User Centered Design Canvas
To help the team better understand their target customers, define the product market fit, determine the competitive advantages and work towards a unique value proposition, I worked through the User Centered Design canvas with senior stakeholders. I find this to be an effective tool to facilitate the user experience design process.
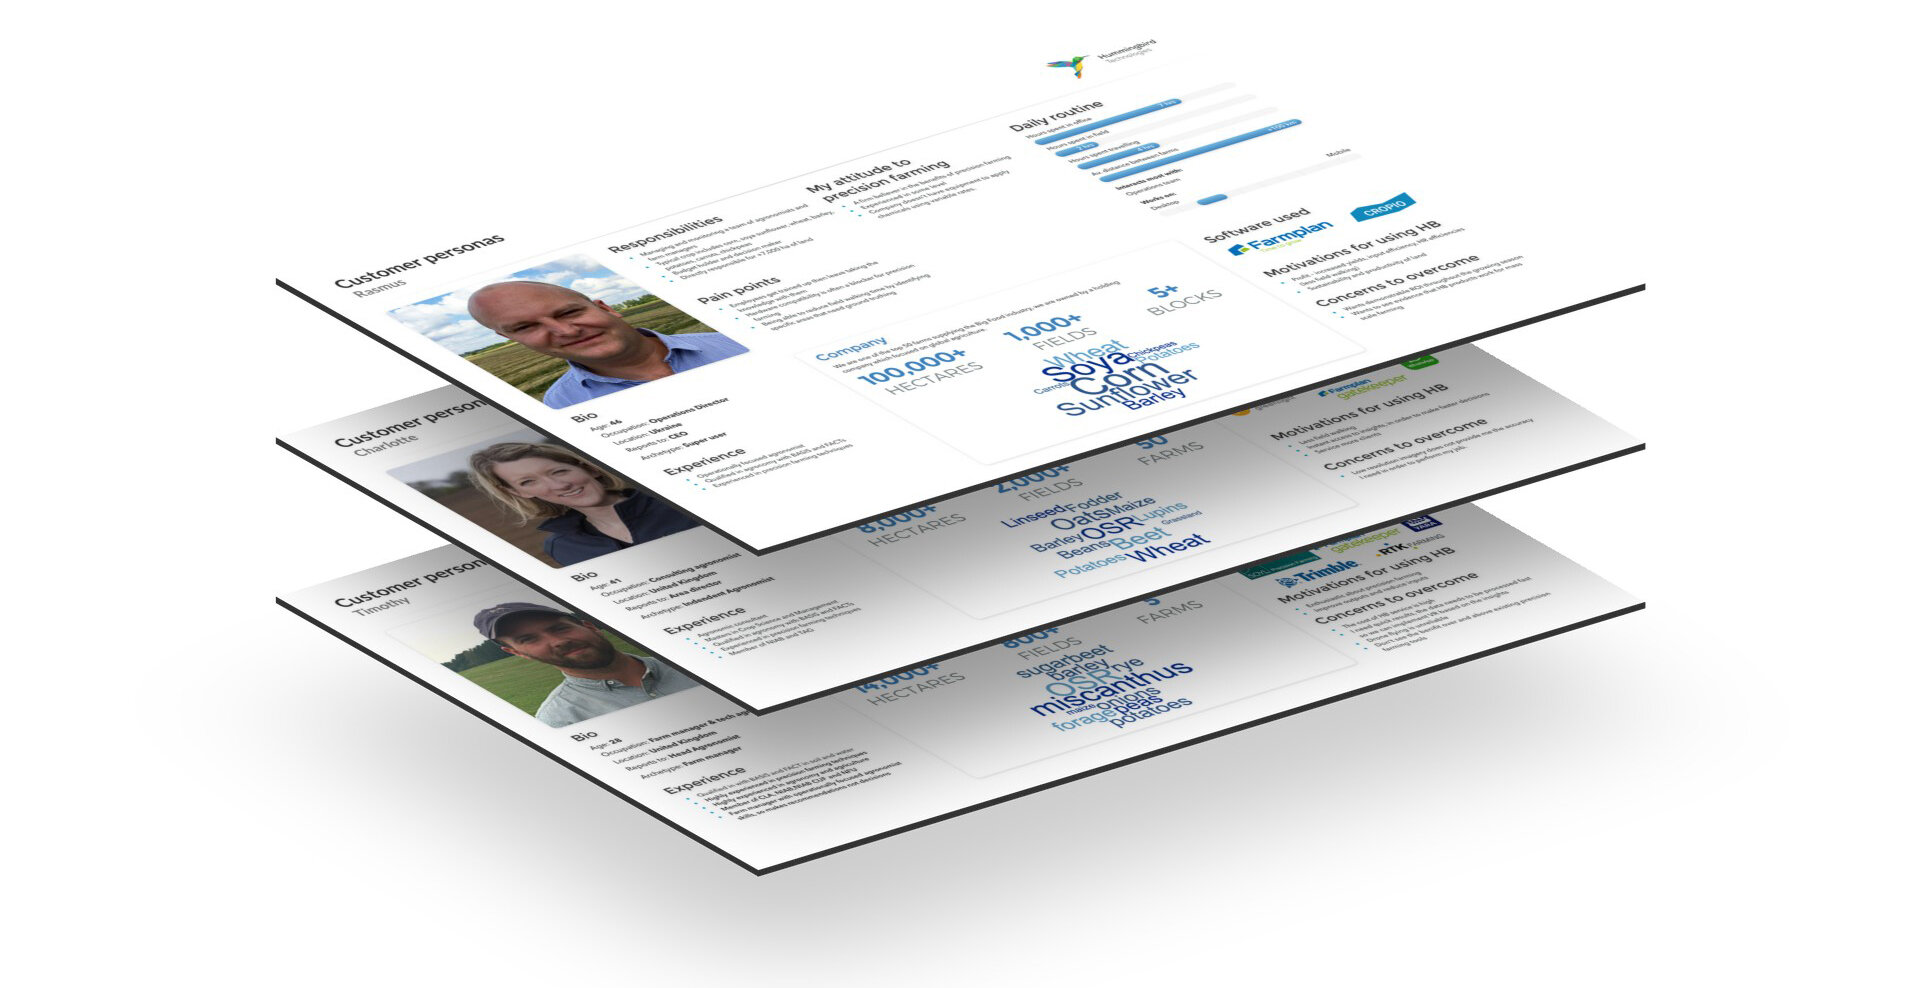
Customer Personas
To help define the problem that Hummingbird customers are facing, I led a variety of customer research sessions including interviews and questionnaires and used this information to build customer personas.
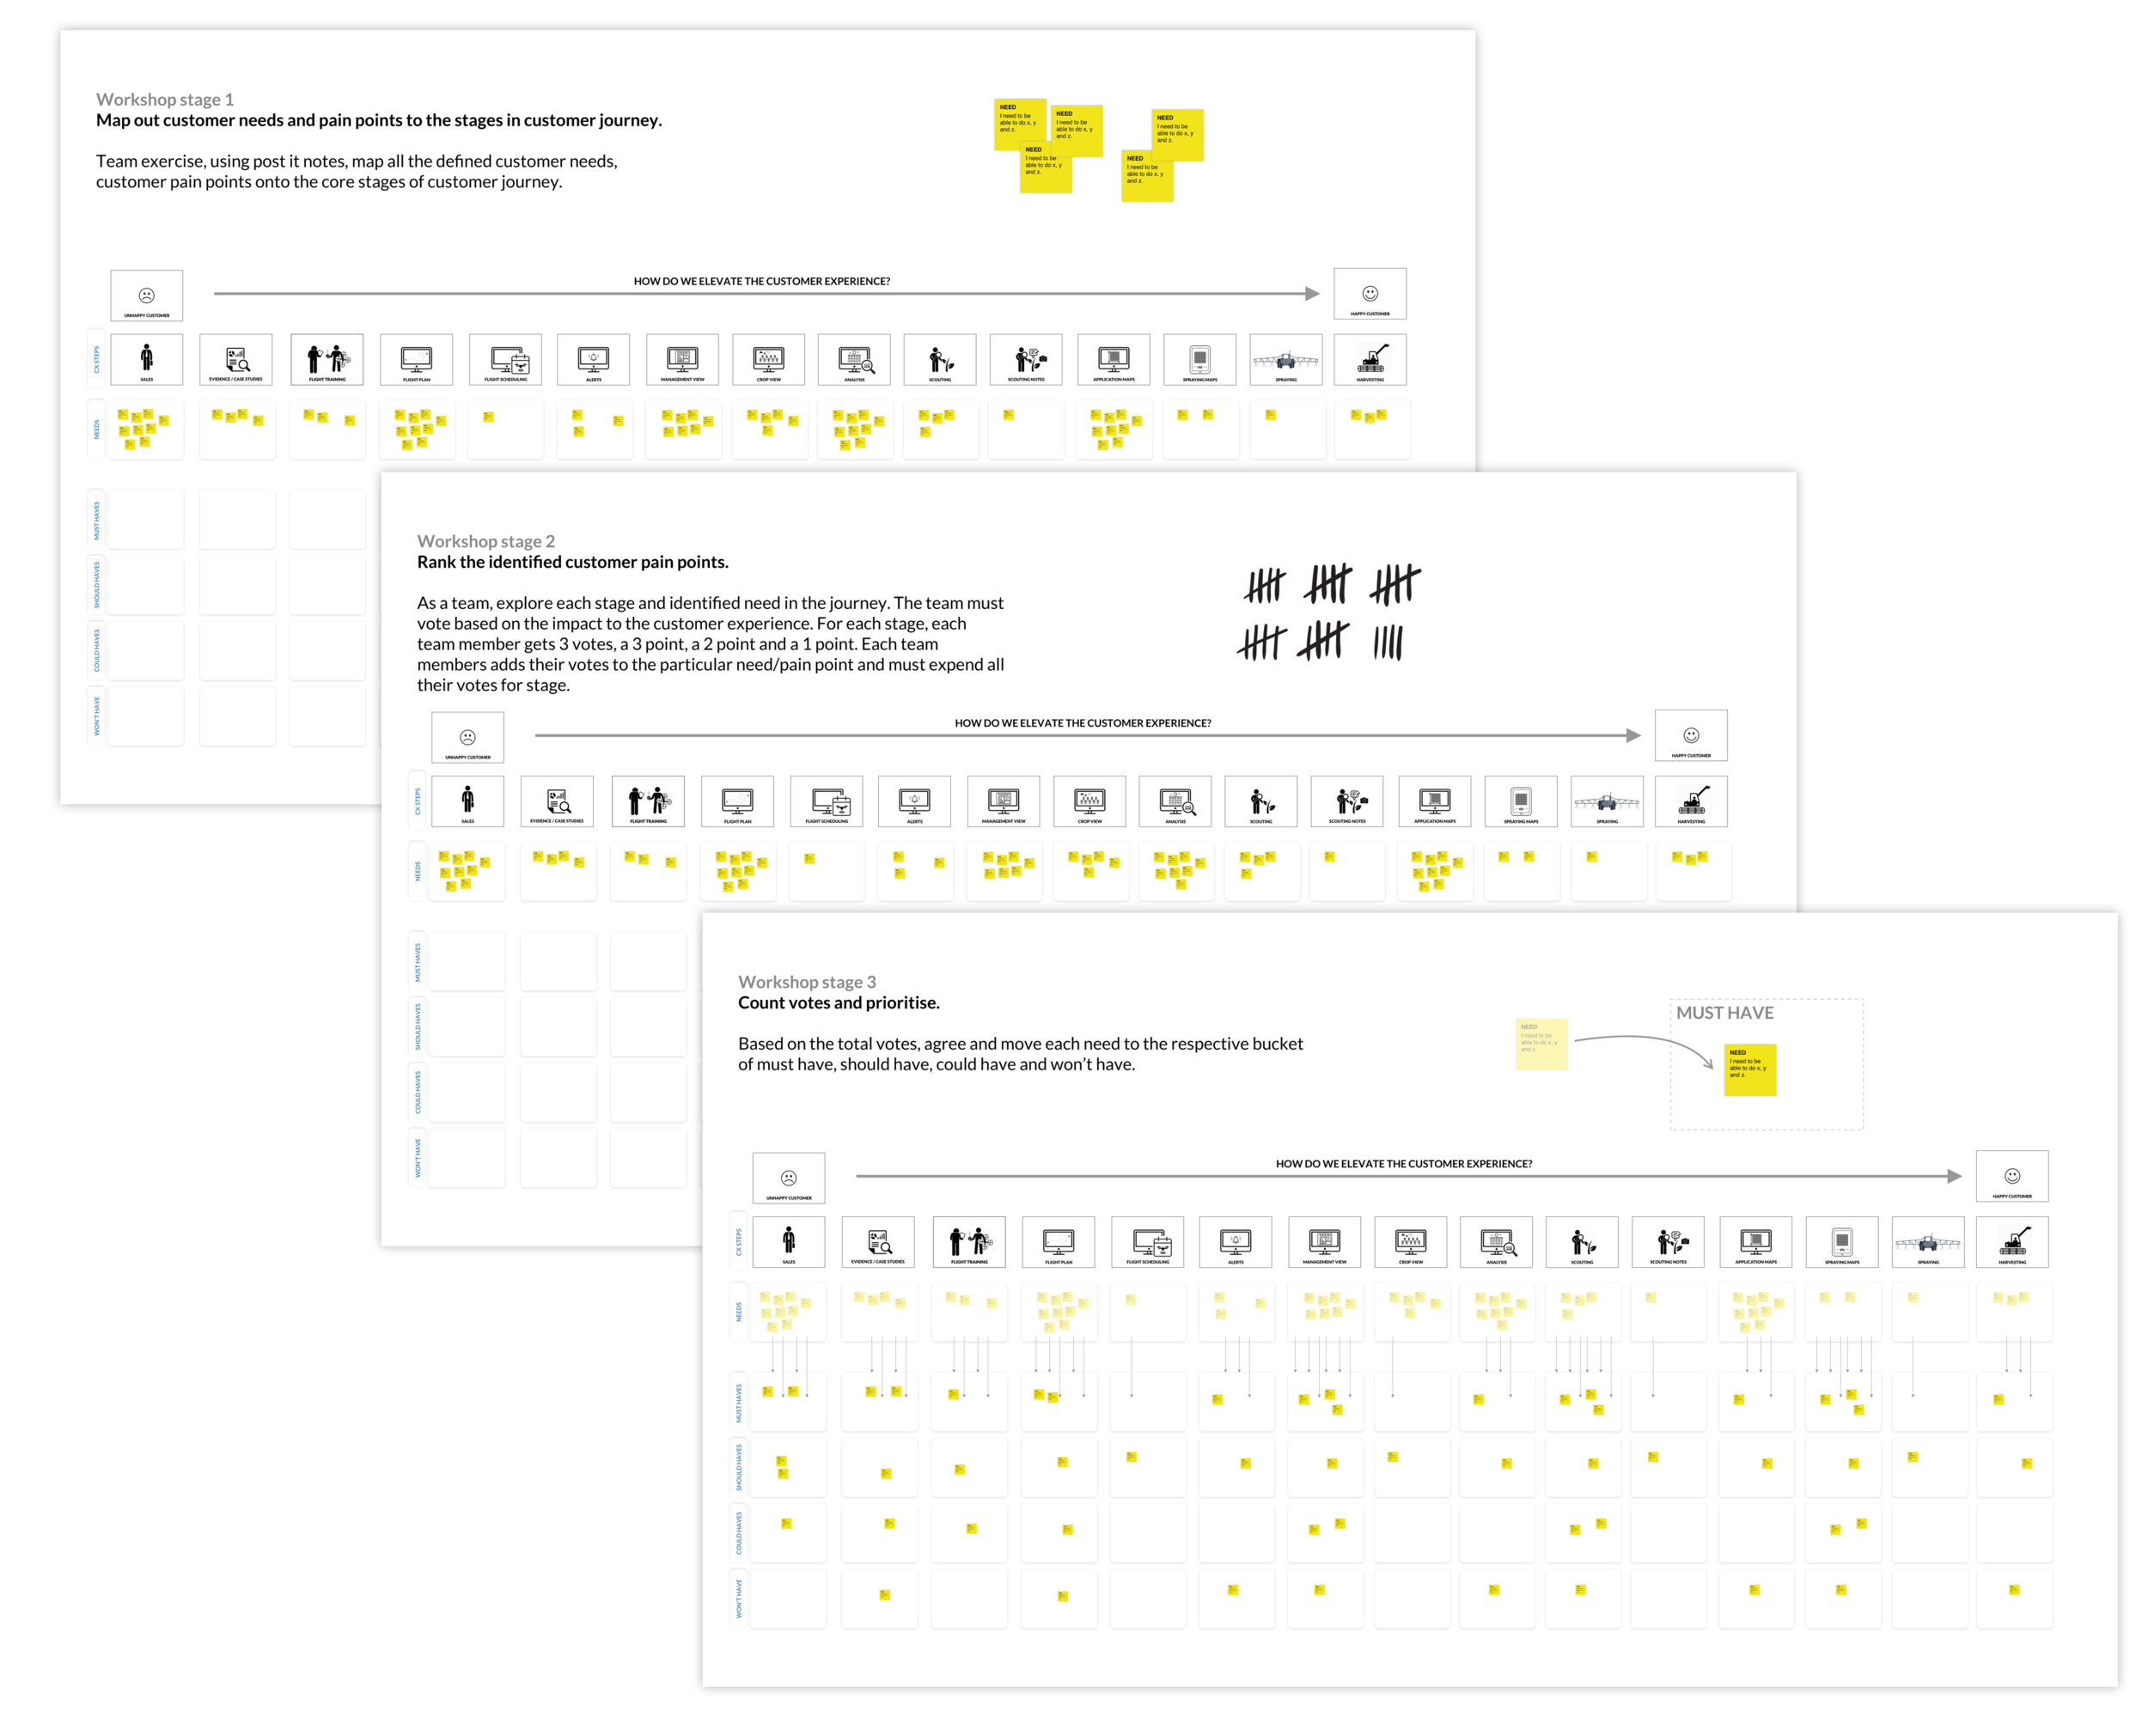
Workshop planning
I planned a stakeholder workshop to help prioritise product focus in order to better meet customer needs and solve customer pain points.
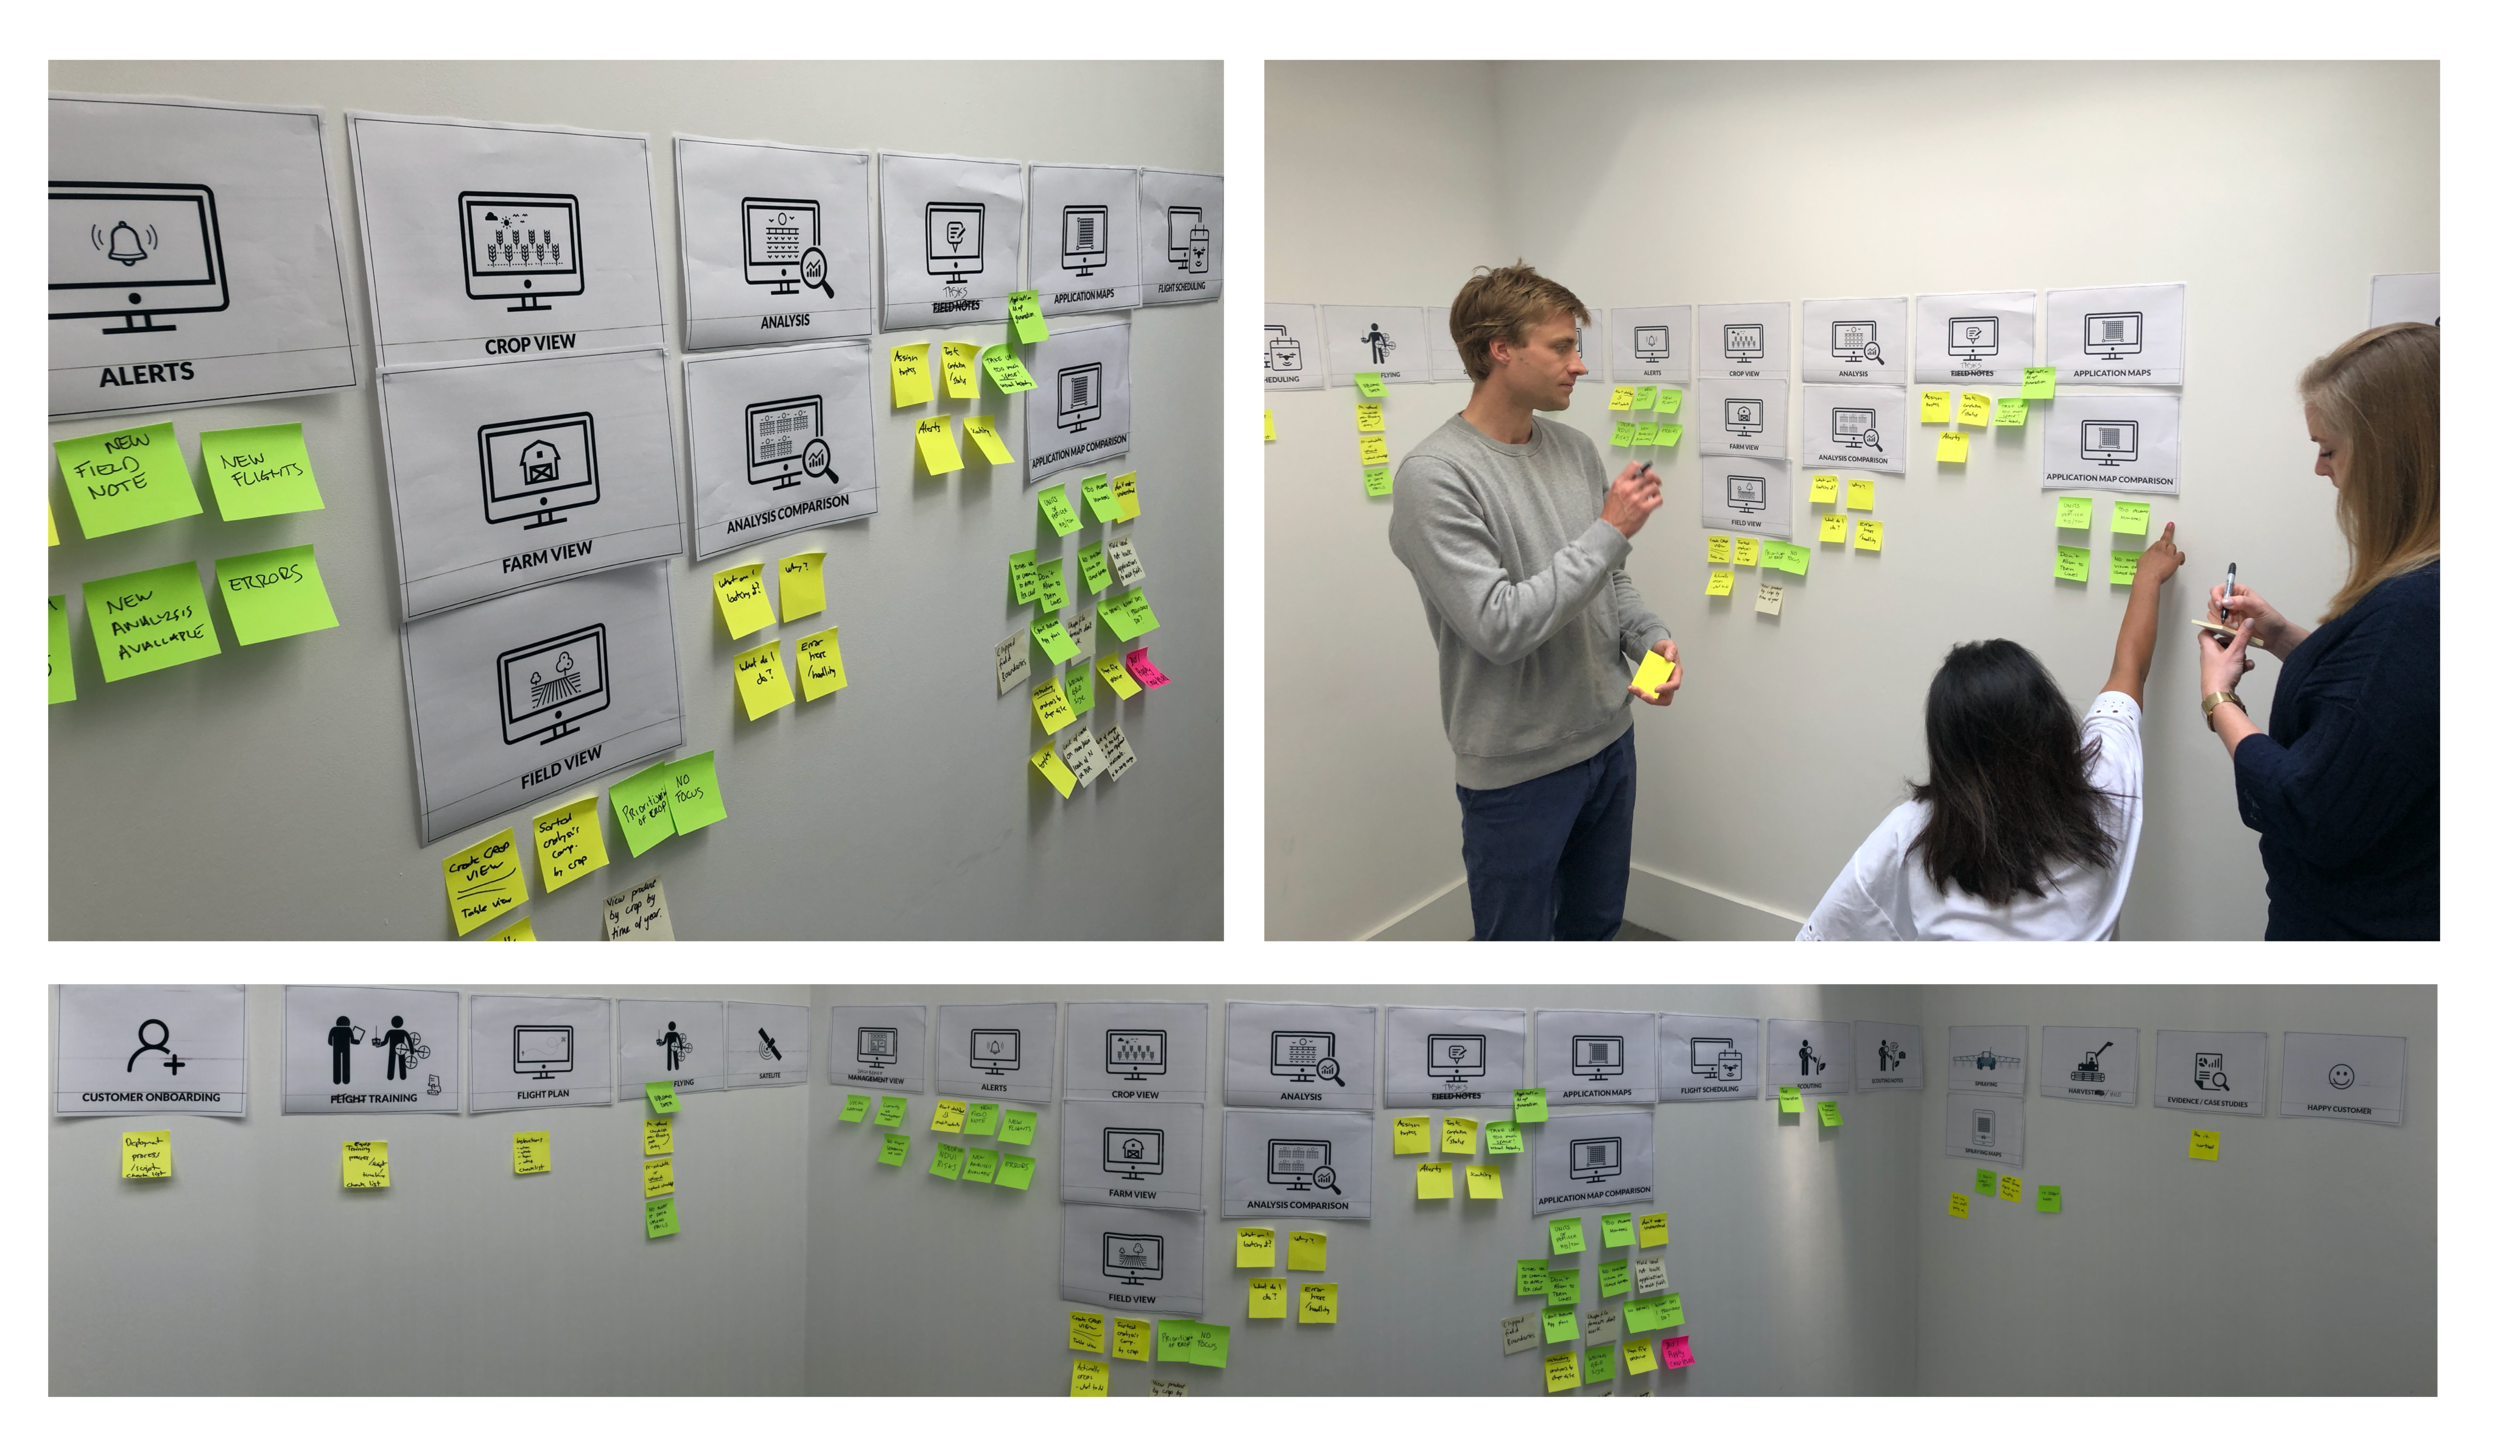
Workshop facilitation
As facilitator of the stakeholder workshop it was my role to get the team thinking, listening to feedback and agreeing on necessary action points and next steps.
Customer Experience Mapping
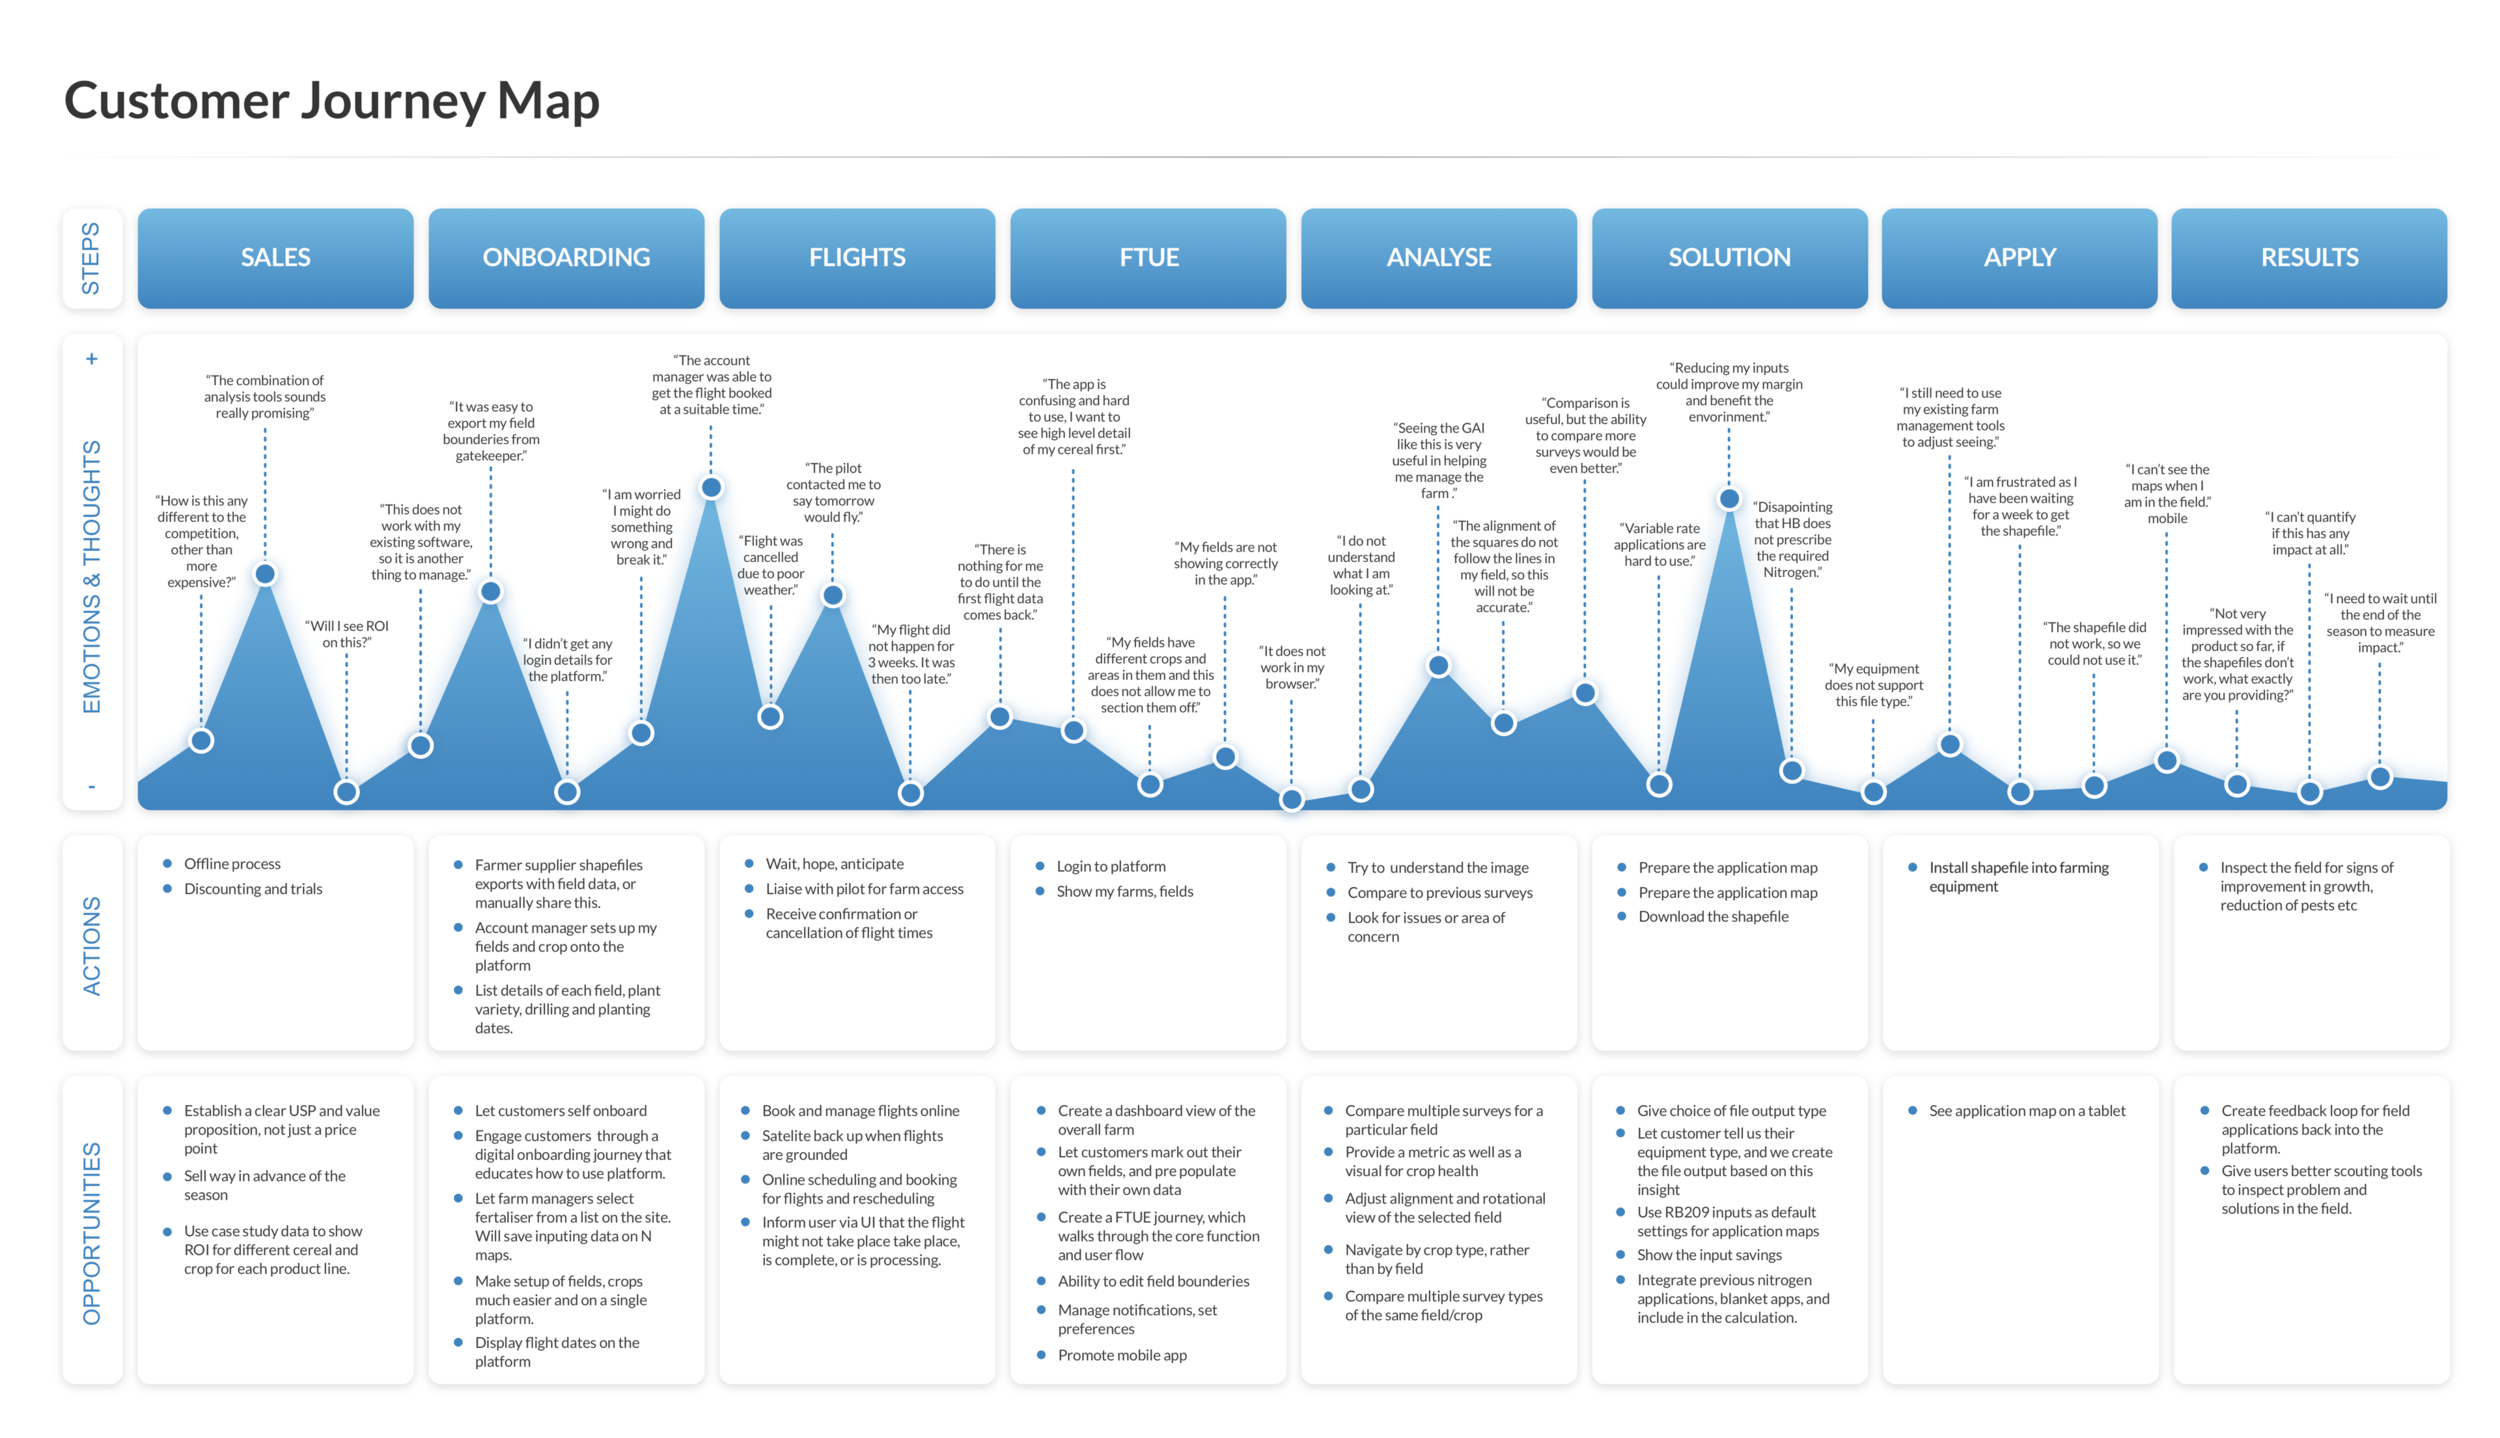
Using the data collected from qualitative research, customer feedback and stakeholder workshops I mapped out an end-to-end customer experience map. This focused on the key product touch points (online and offline) throughout the customer journey.
Using extensive customer feedback I then mapped out customer satisfaction as an emotional response to illustrate where the product was delivering on its promise and where it needed some evolution. This was used to focus stakeholders and to prioritise design tasks.
Implement a design methodology
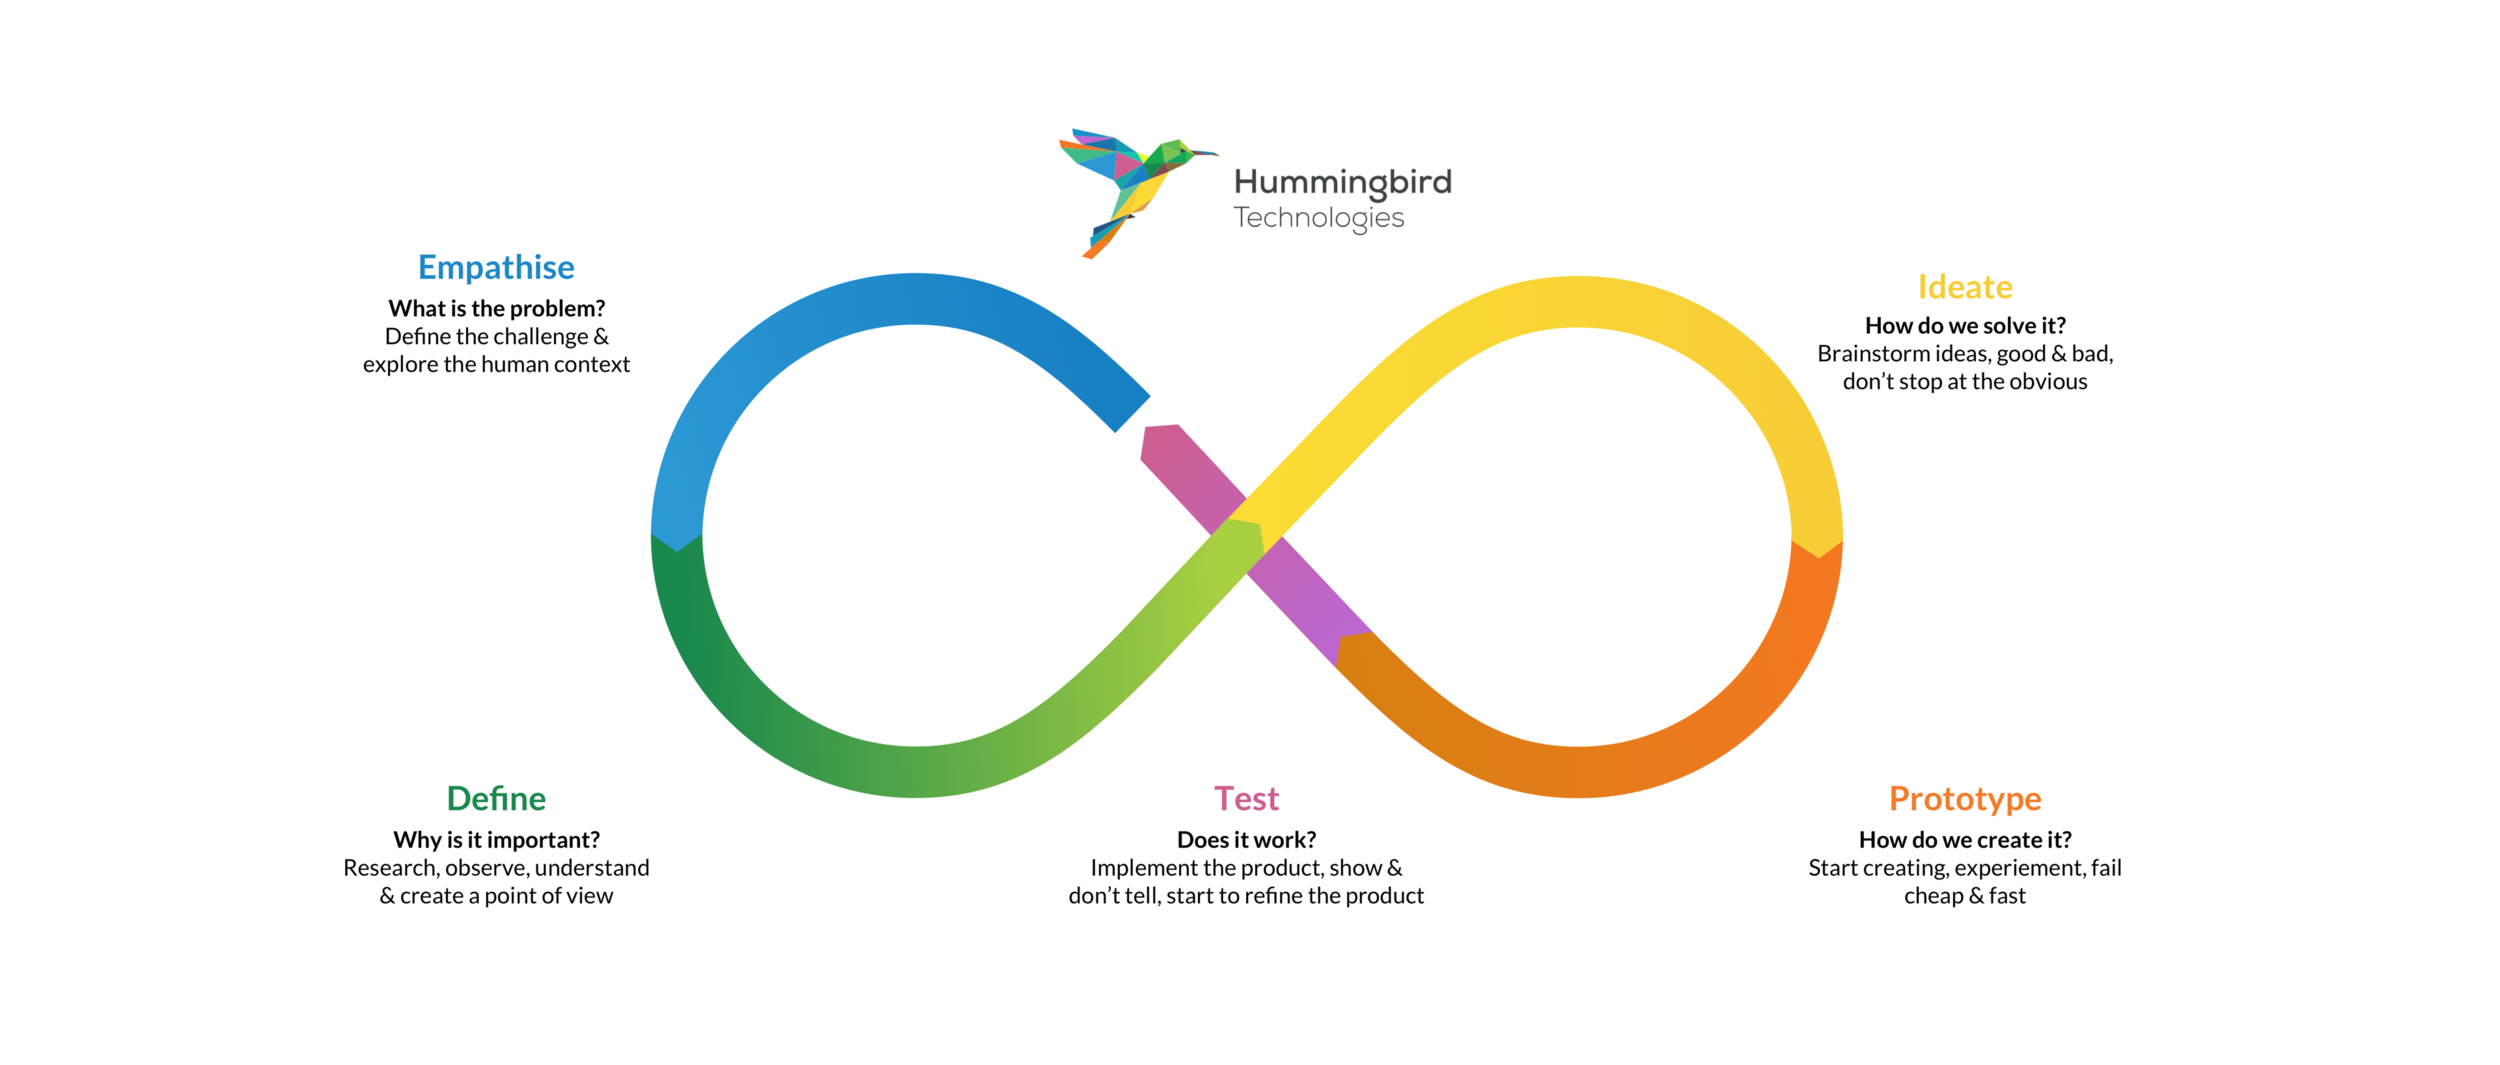
A key responsibility at Hummingbird was to establish a working methodology to help drive the product design forward and to align stakeholders in the role of the product design function within the company. For this, I chose the Design Thinking framework as it's easy to understand, quick to implement and great for getting stakeholder confidence.
Self onboarding - key capability
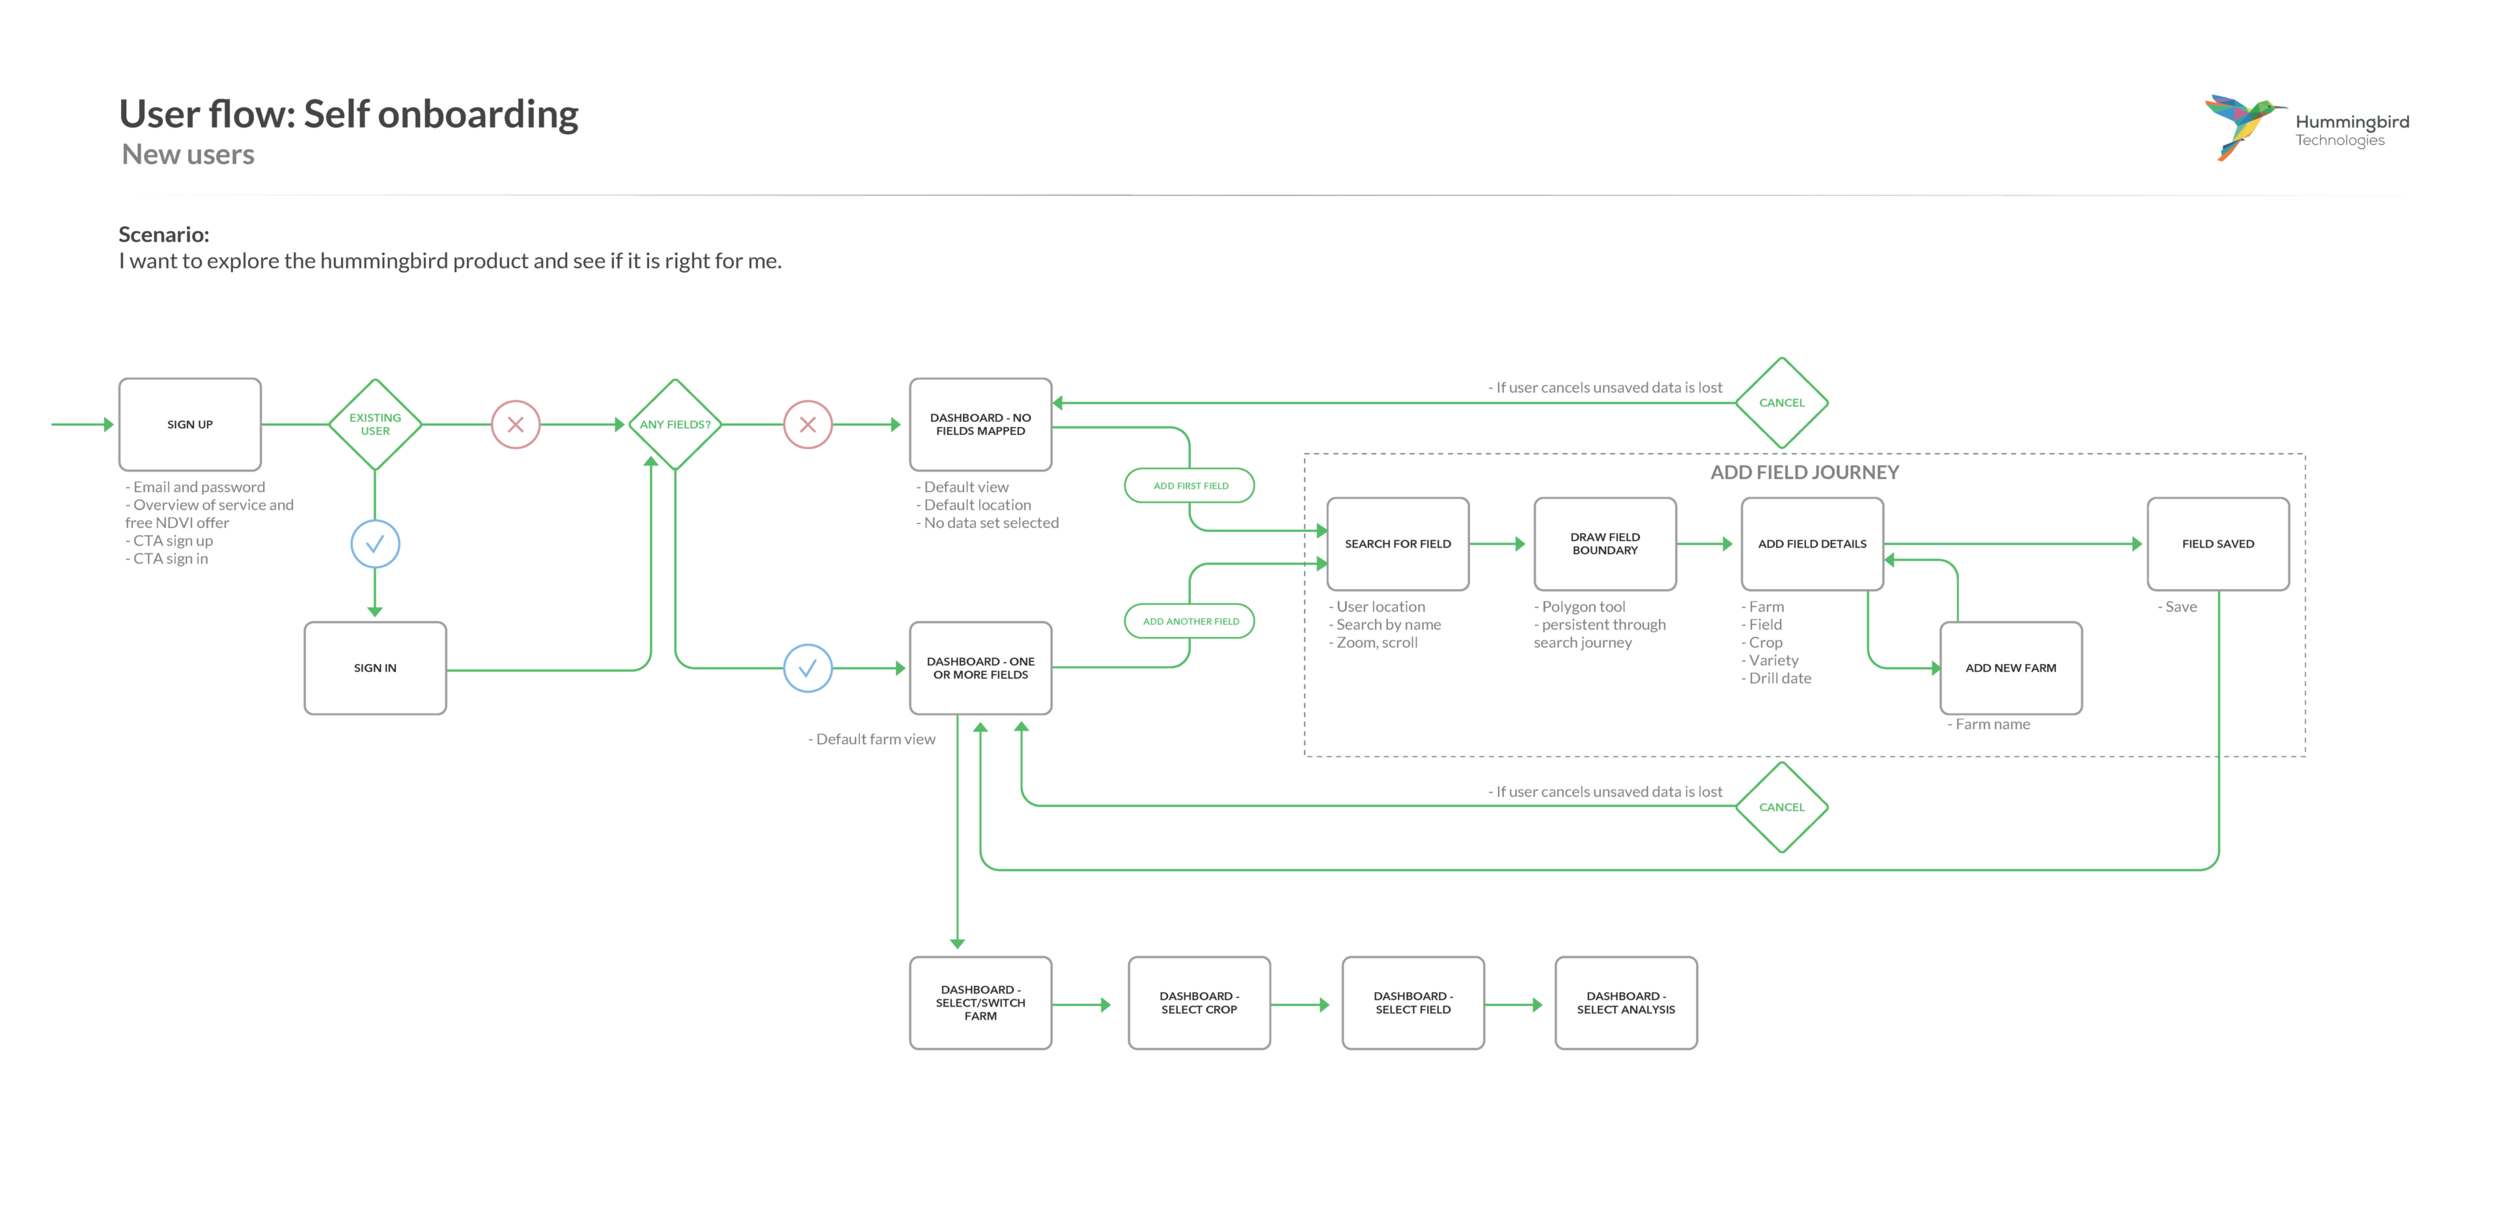
One of the major pain points identified through the research was that customers could not onboard themselves and add their own field boundaries to the platform. This was all previously done manually by the sales team. Having a good understanding of how farm managers worked and of the technical and processing restraints of the products backend, I architected user flows for a self onboarding service that allowed new customers to sign up and add their own field boundaries as a way of trialing the product offering before subscription.
Ideate. Prototype. Test.
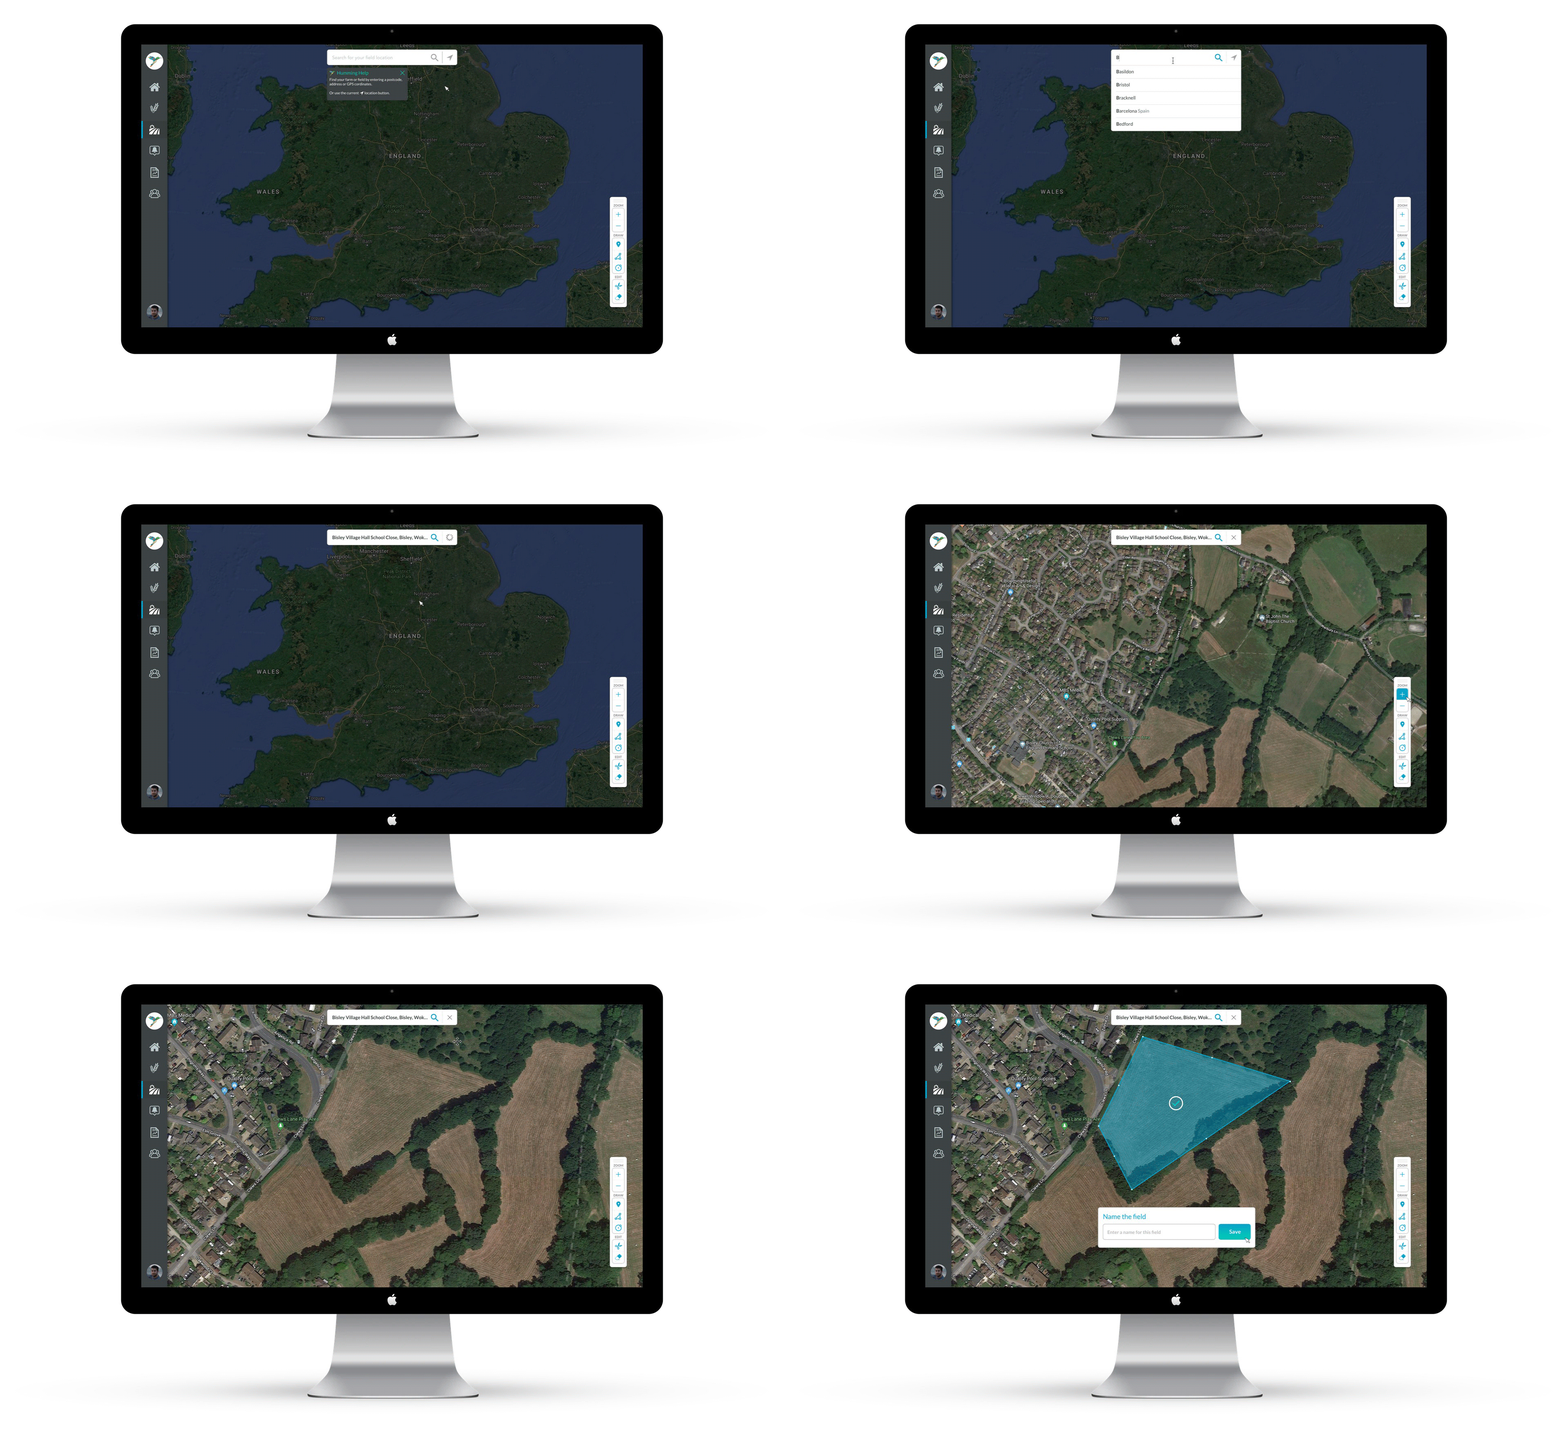
As part of the iterative design process I produced a number of wireframe and high fidelity prototypes to test with customers. The prototypes were tested with real users either remotely or in person.
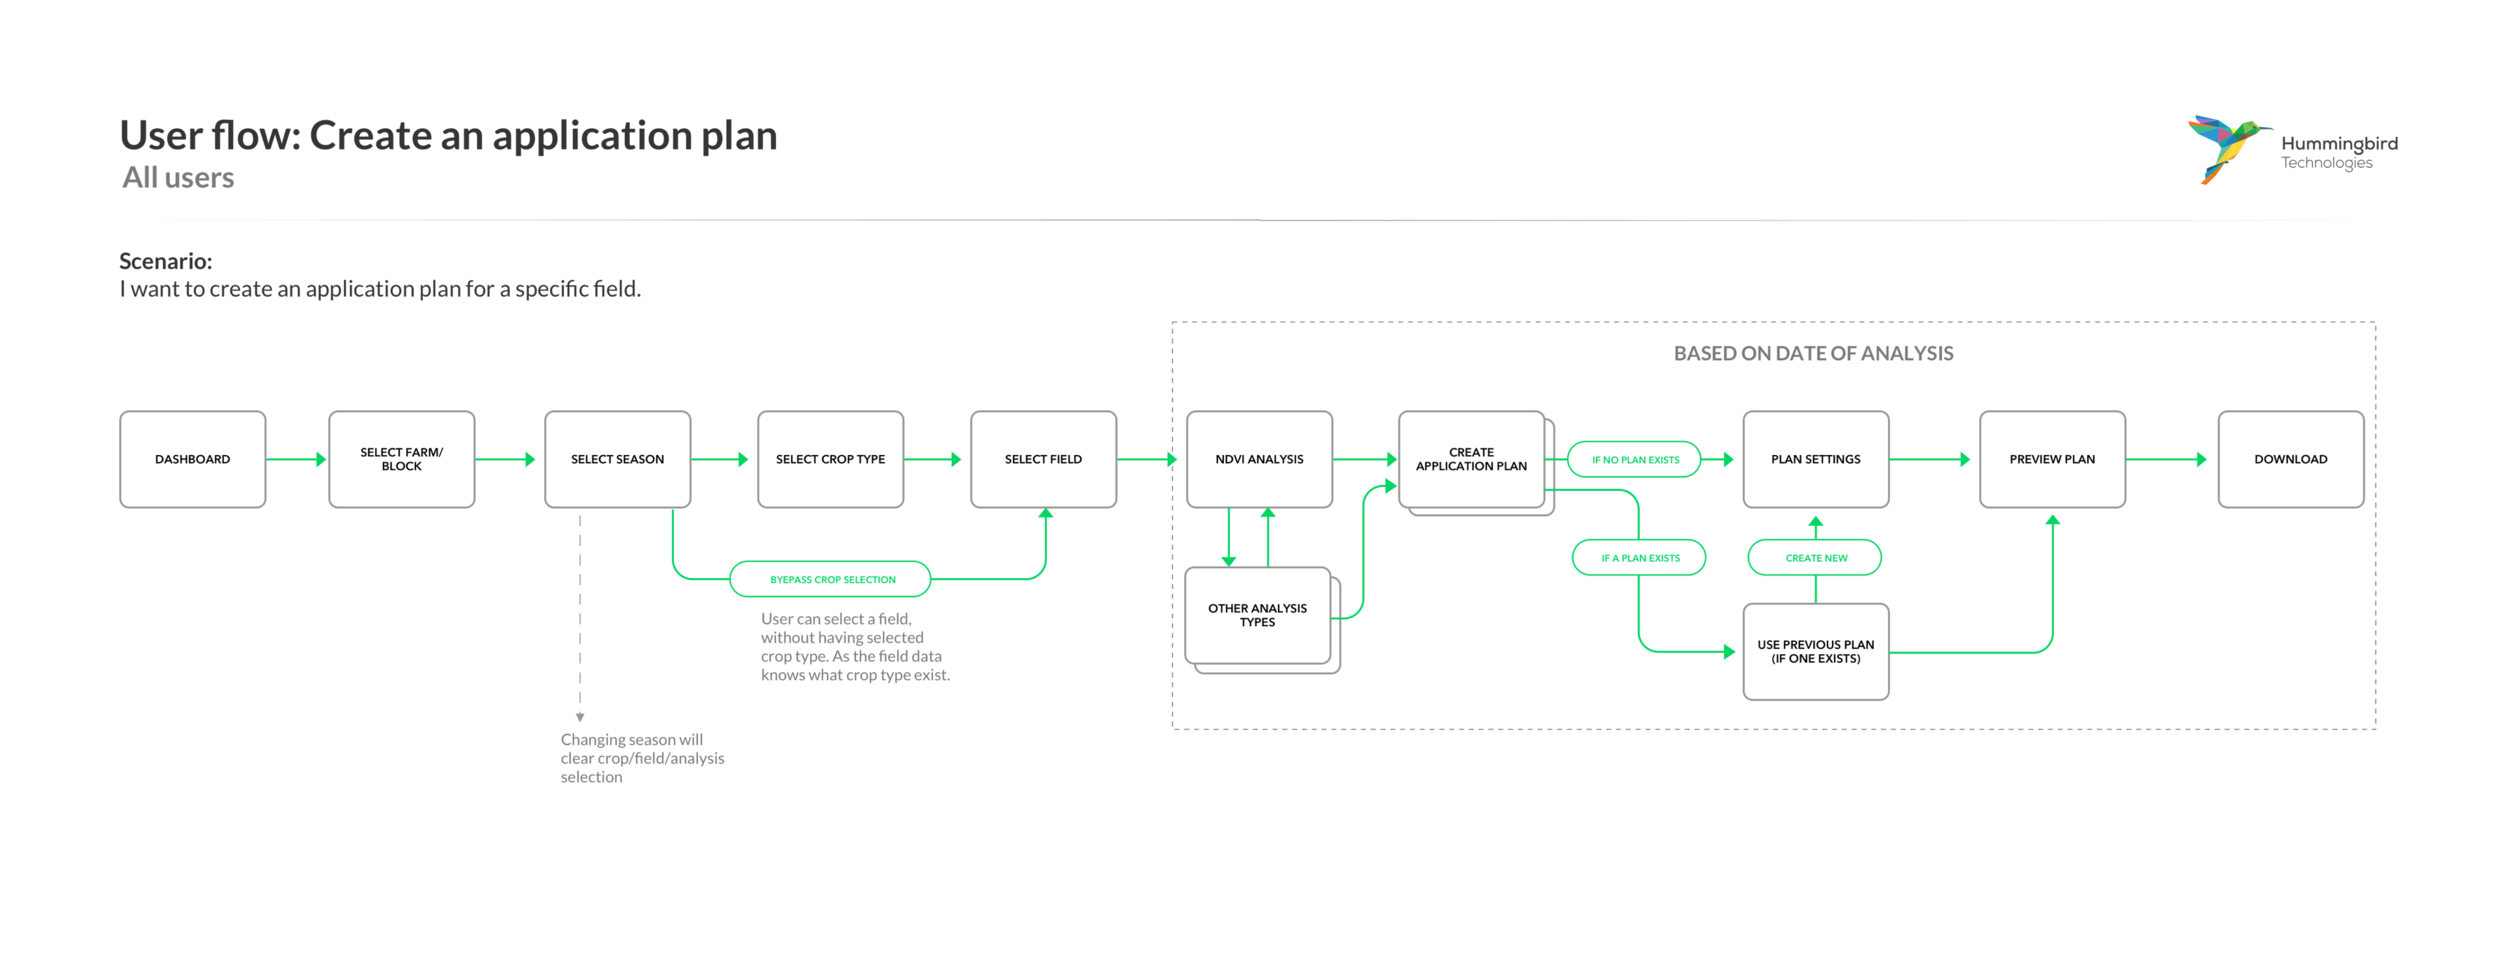
Application Plans - key capability
One of the core reasons to use the product is to create an application plan, this plan tells the farming equipment what to do. In this case, how much nitrogen fertiliser to spray on areas of the field where the crop needs it most. I created a user flows for this process that followed the way a farm manager thinks and works.
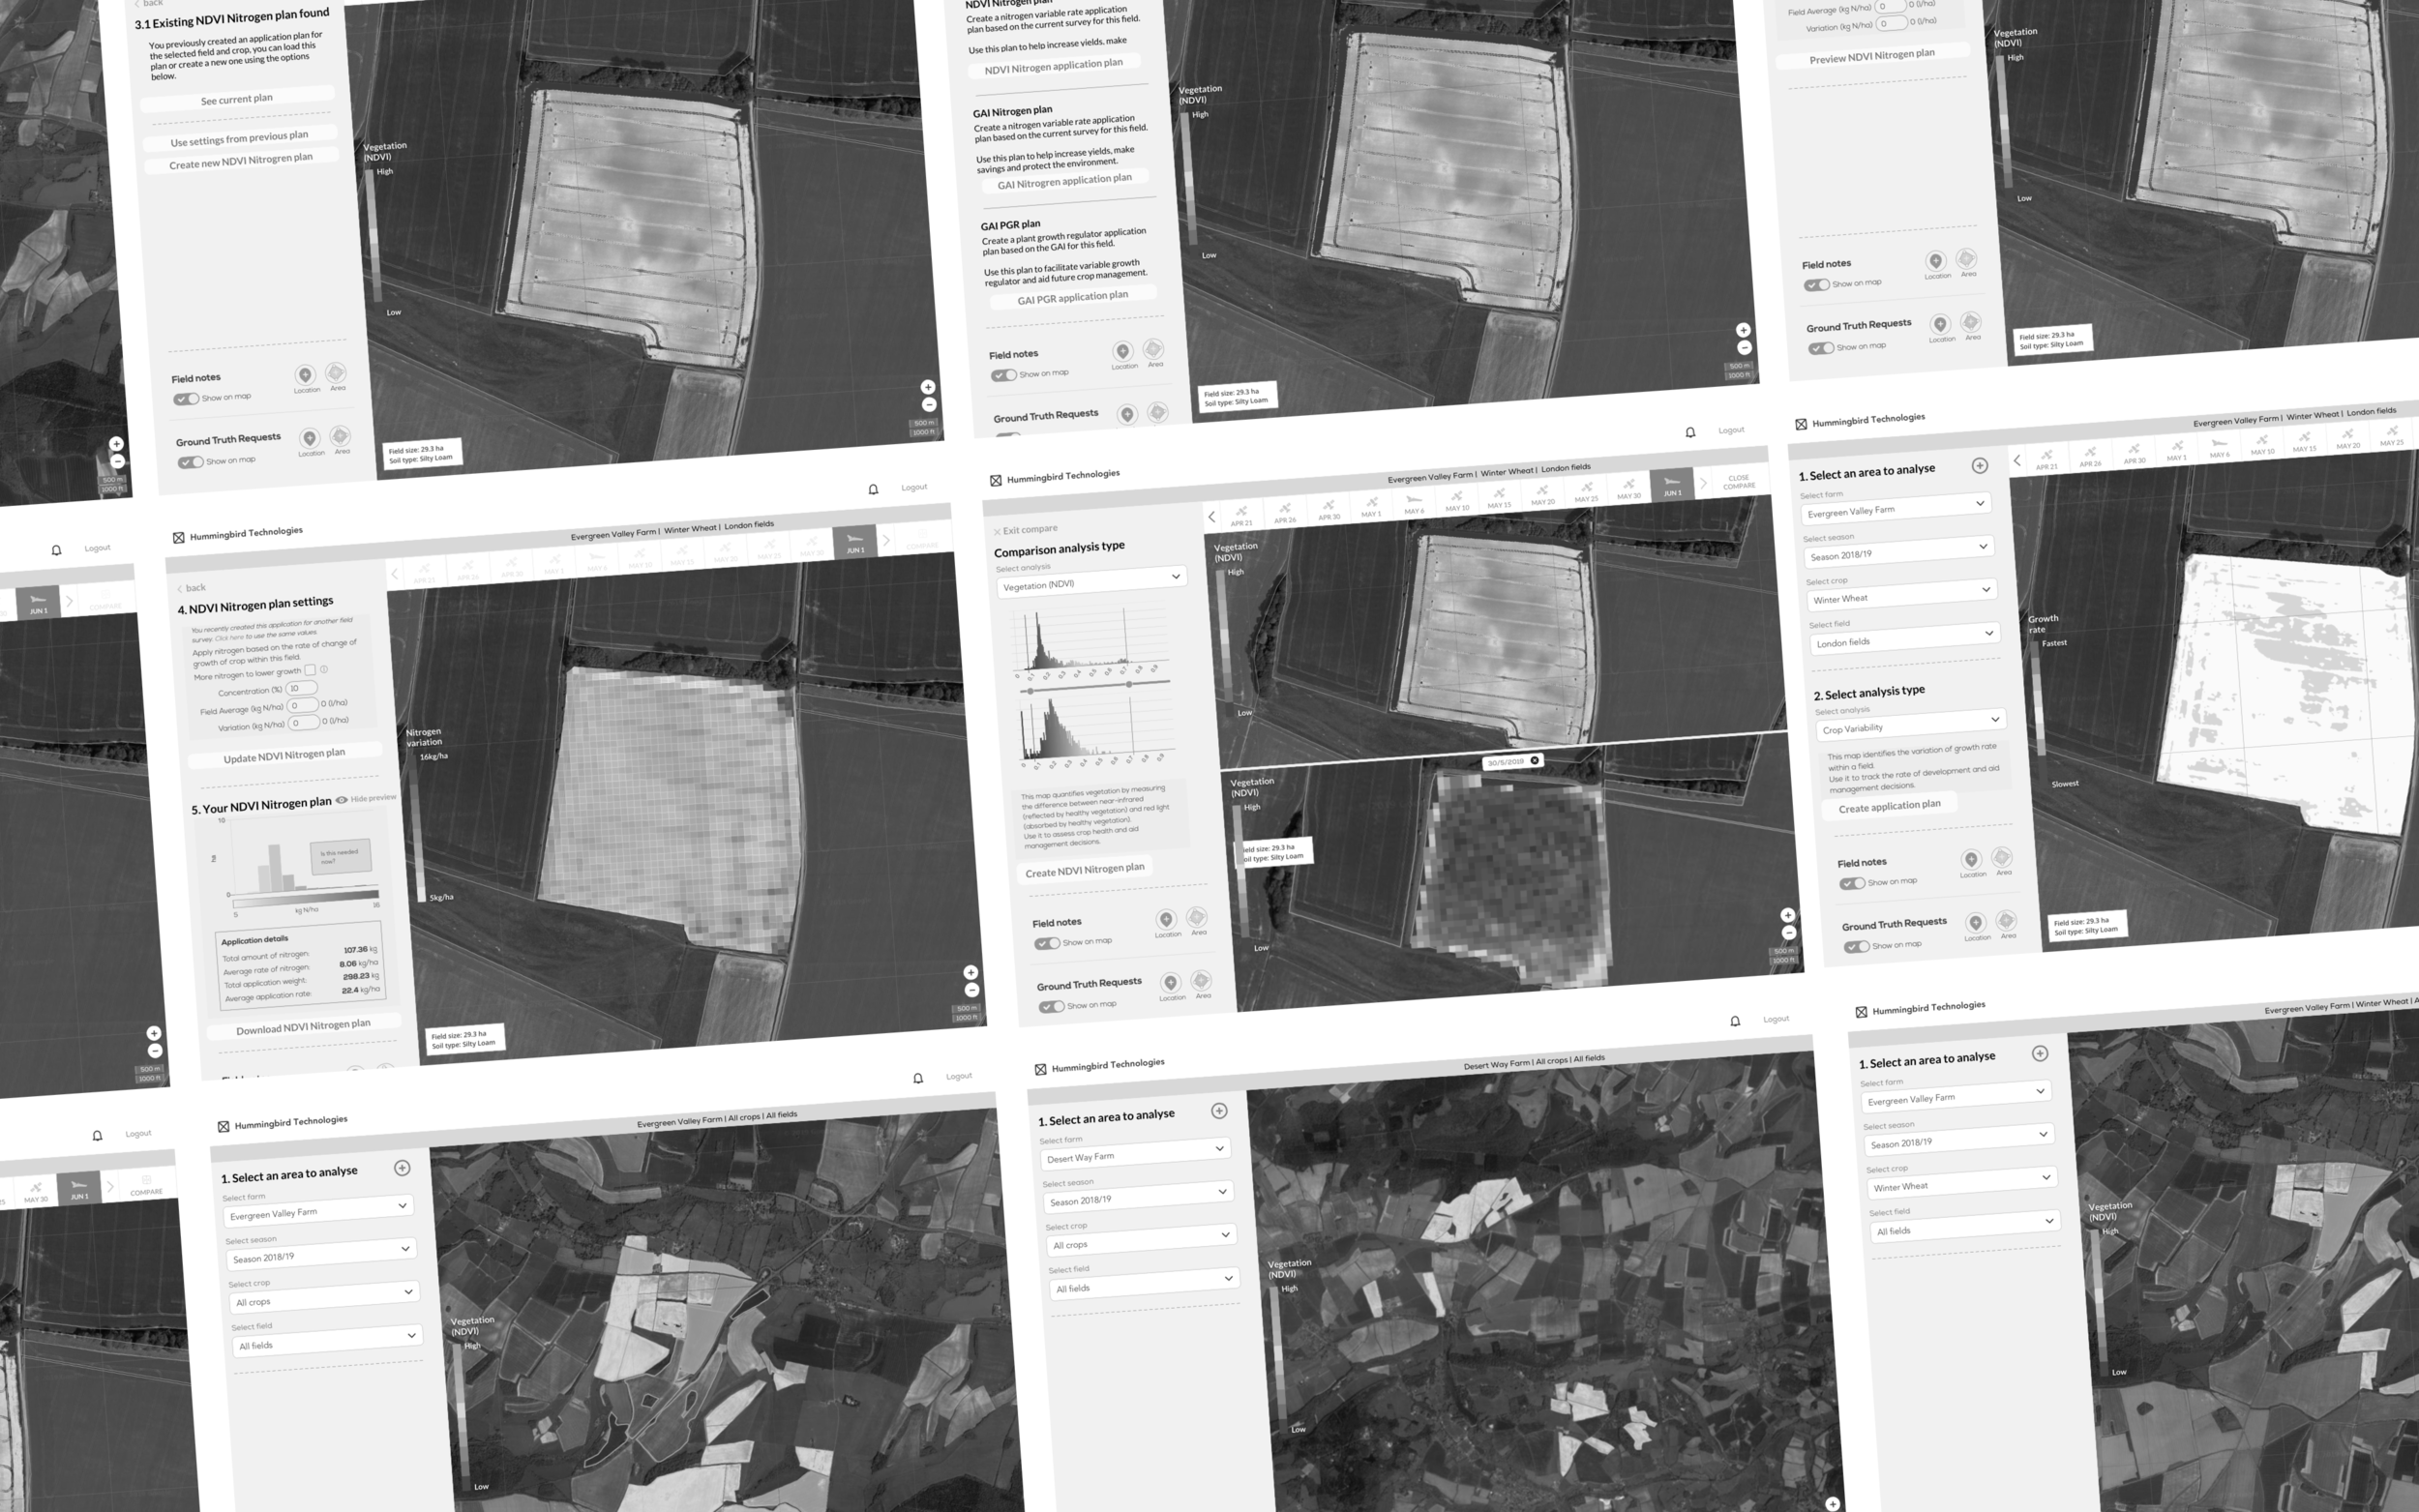
Wireframes and prototypes
To create an Application Map, various data points and inputs are required from the user, this consists of field geo, weather data, soil type, crop type and more. I created various wireframe iterations and prototypes until our users were successfully reaching the end point without any major issues.
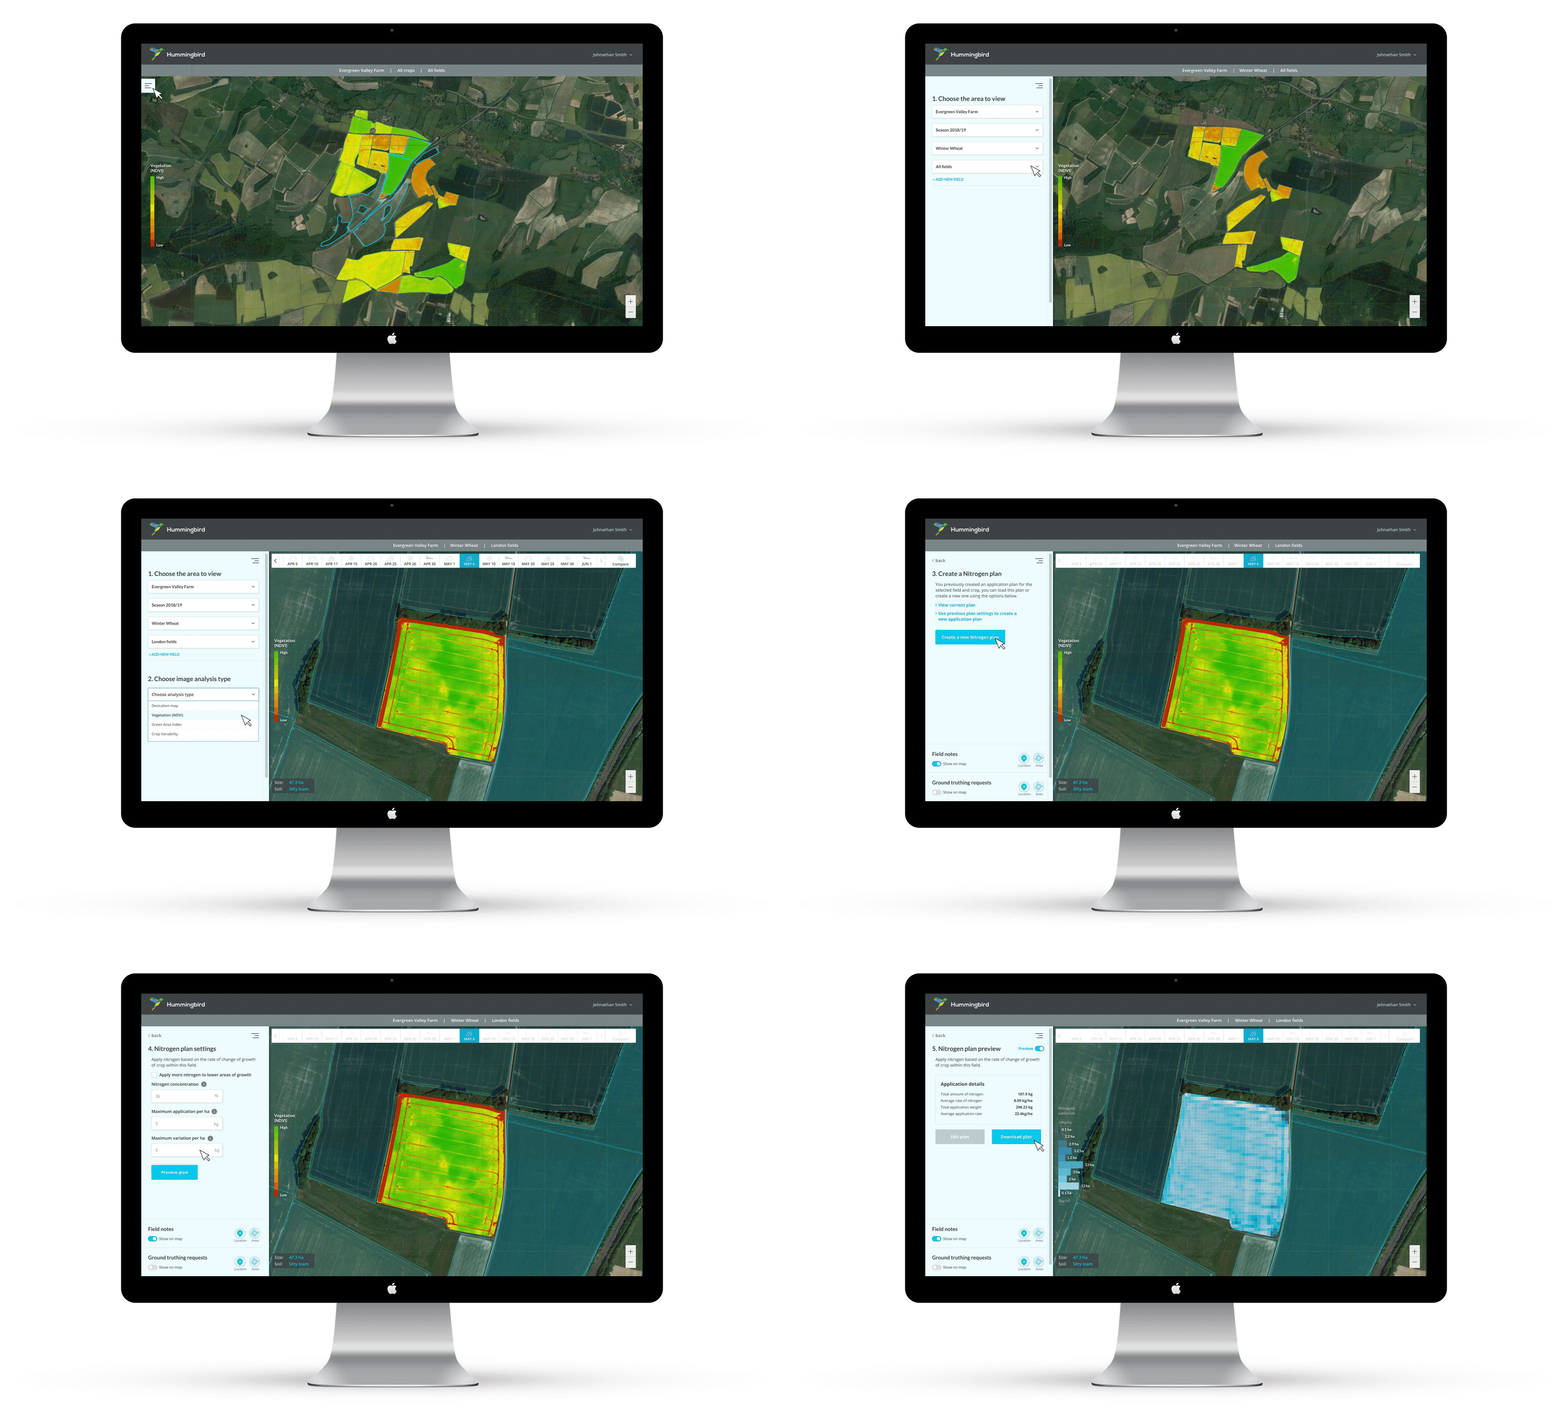
User Interface Design
I evolved the user interface design to be cleaner, easier to use and understand. This involved a revised colour pallet, text and button hierarchy and new components. To document and store all this, I created a basic pattern library which could be expanded over time.
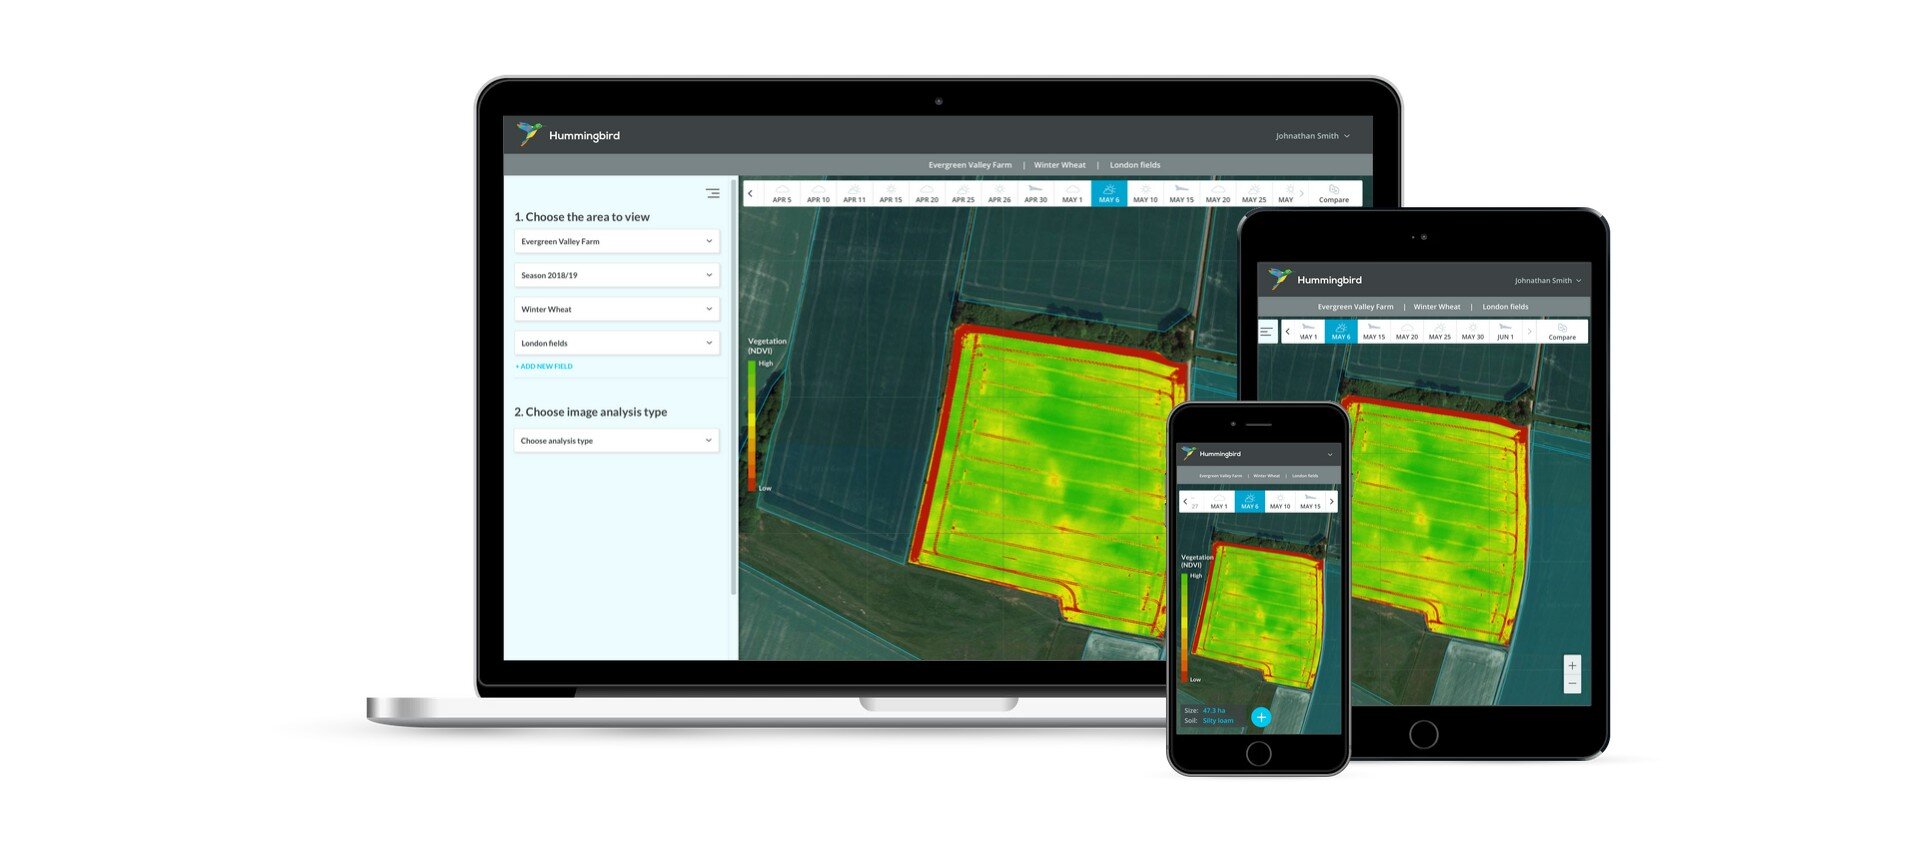
Responsive Web Application
Although the primary users and use cases were heavily desktop based, there are a number of features that need to be accessed and used remotely when out in the field. This need was solved by making the web application responsive to work on tablets and phones.
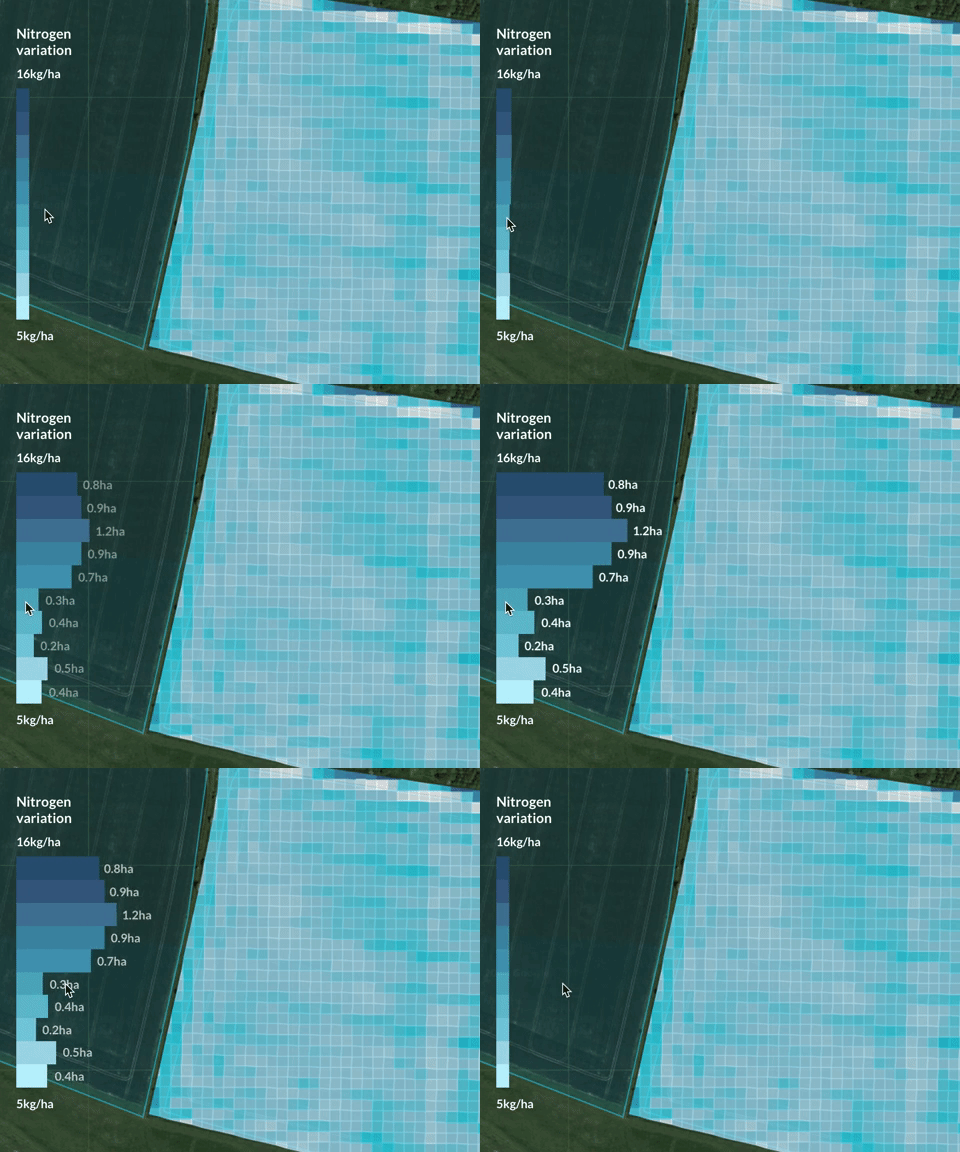
Interaction Design
I crafted a number of design interactions for the interface, including legends, calendar date changers and button states.
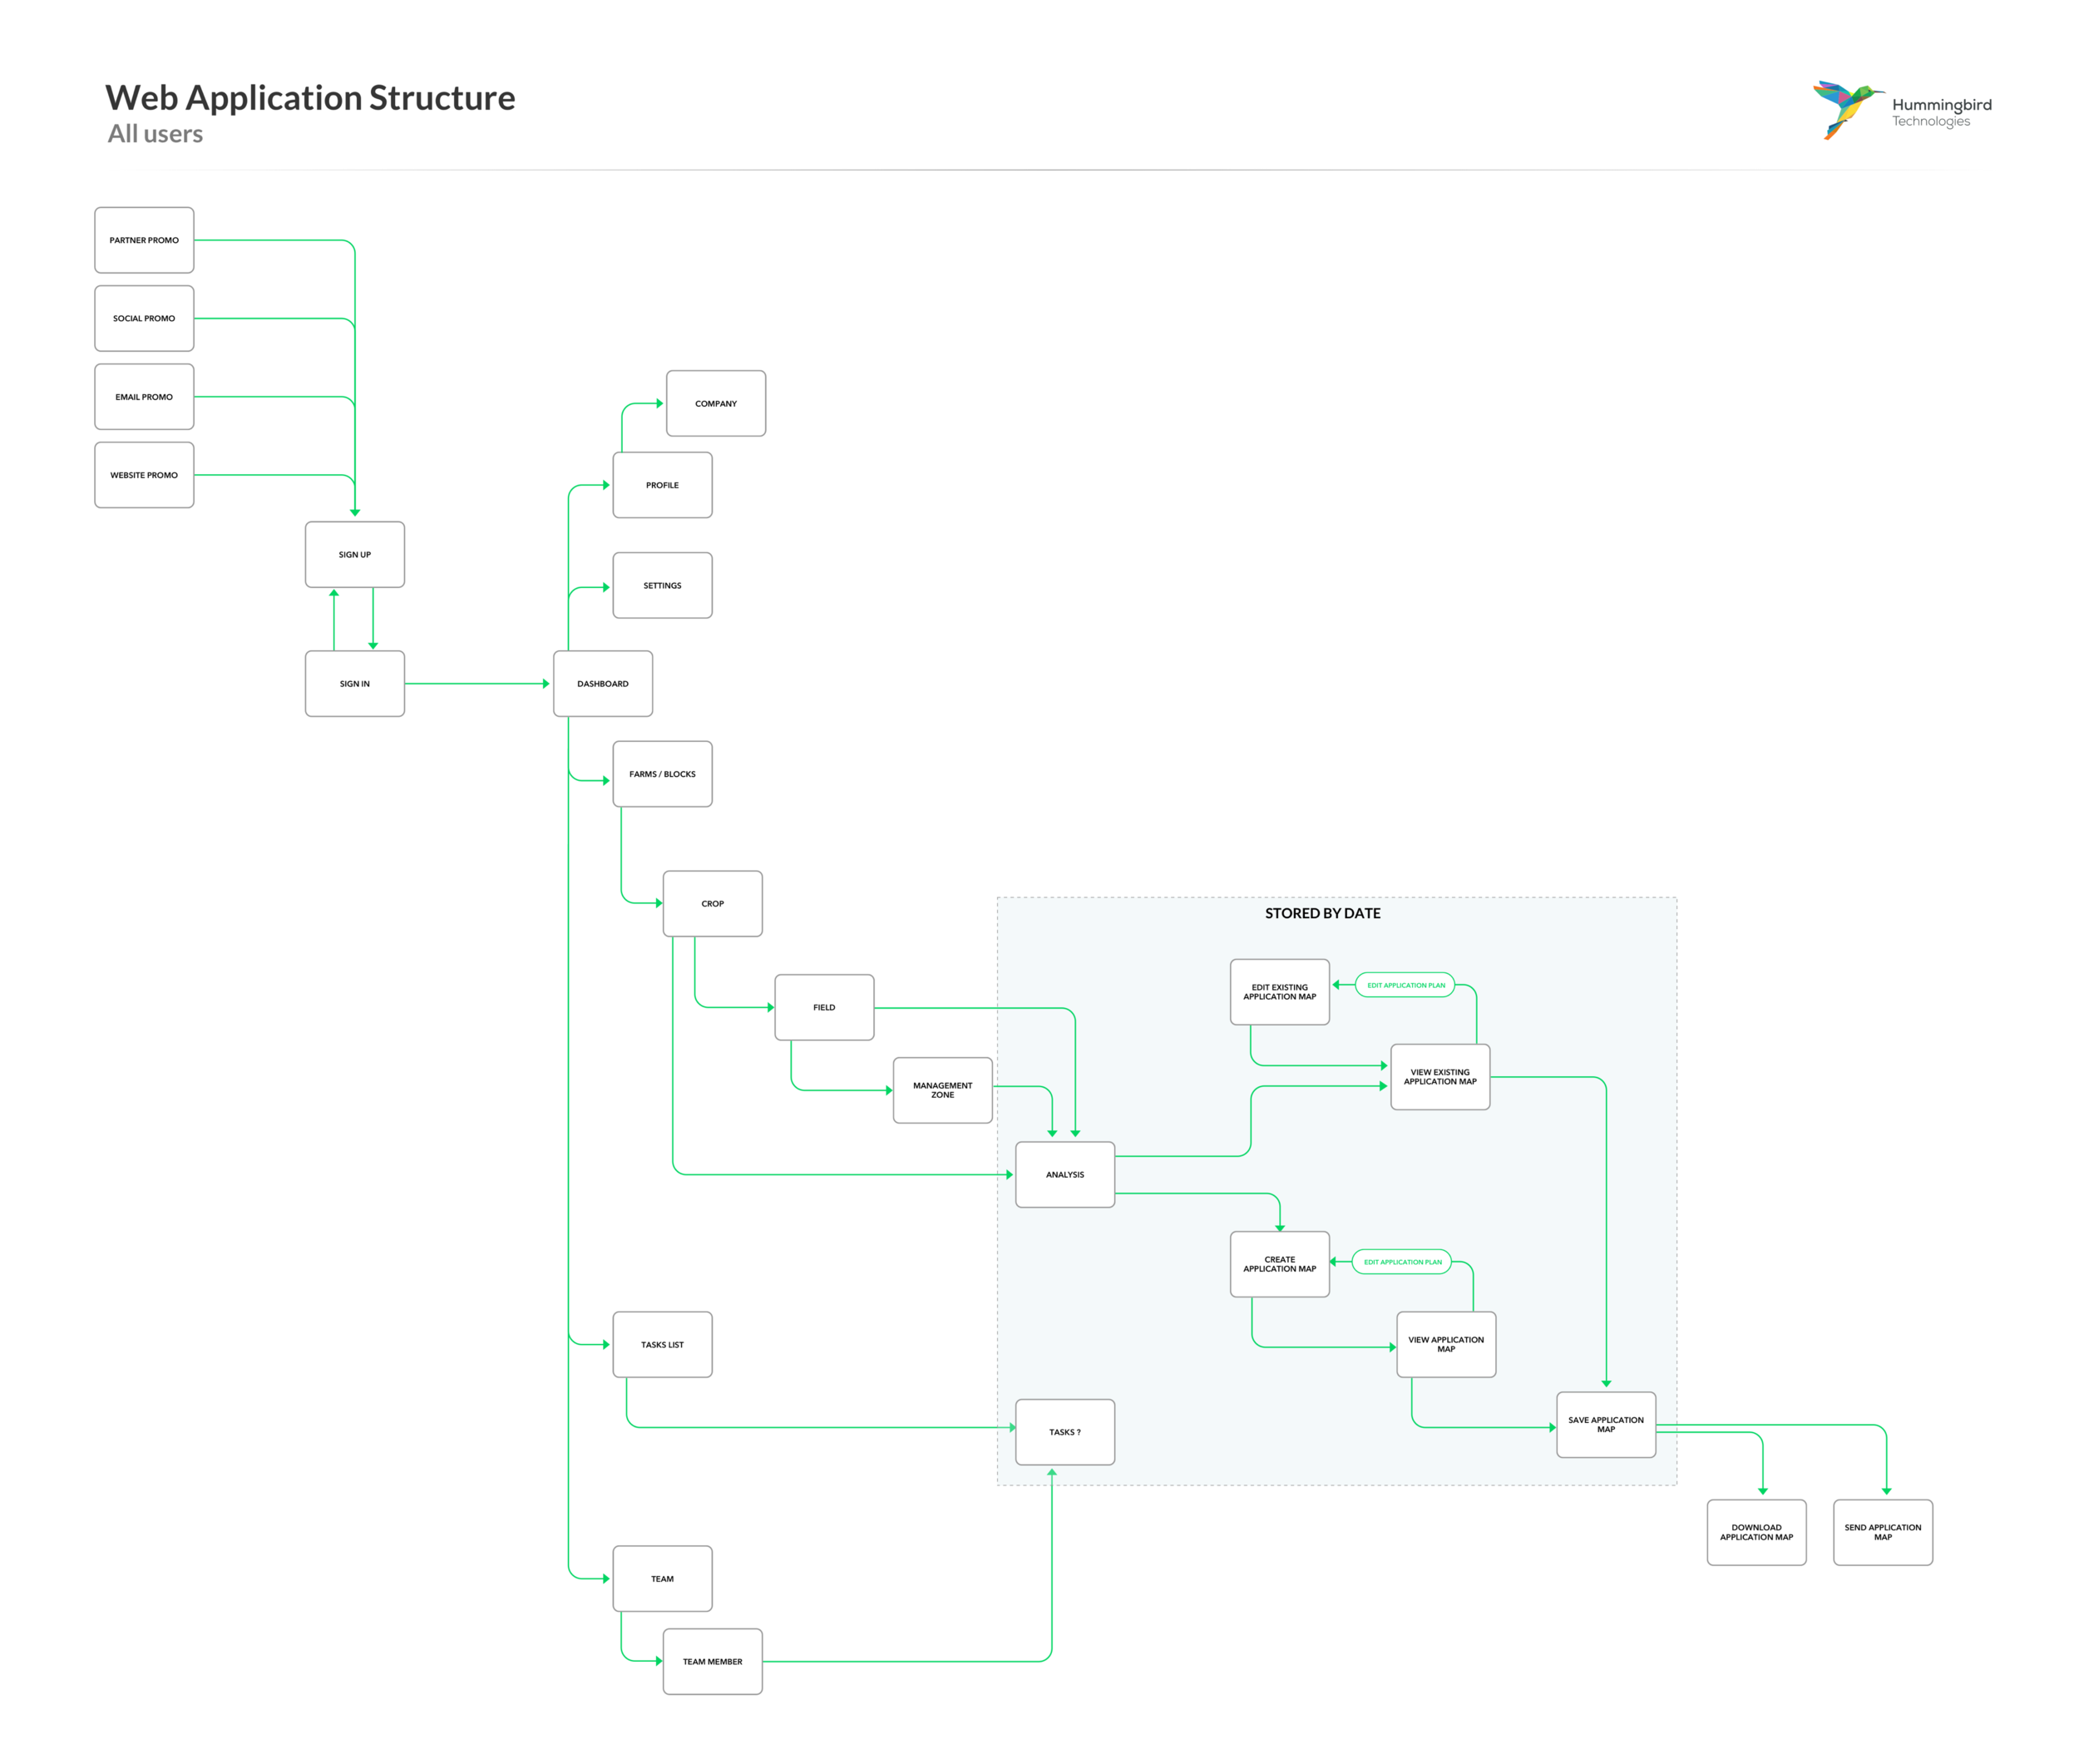
Web Application Architecture
I created an overall application flow and structure which showed the core services and capabilities of the application and how this worked with the various user types and data points.
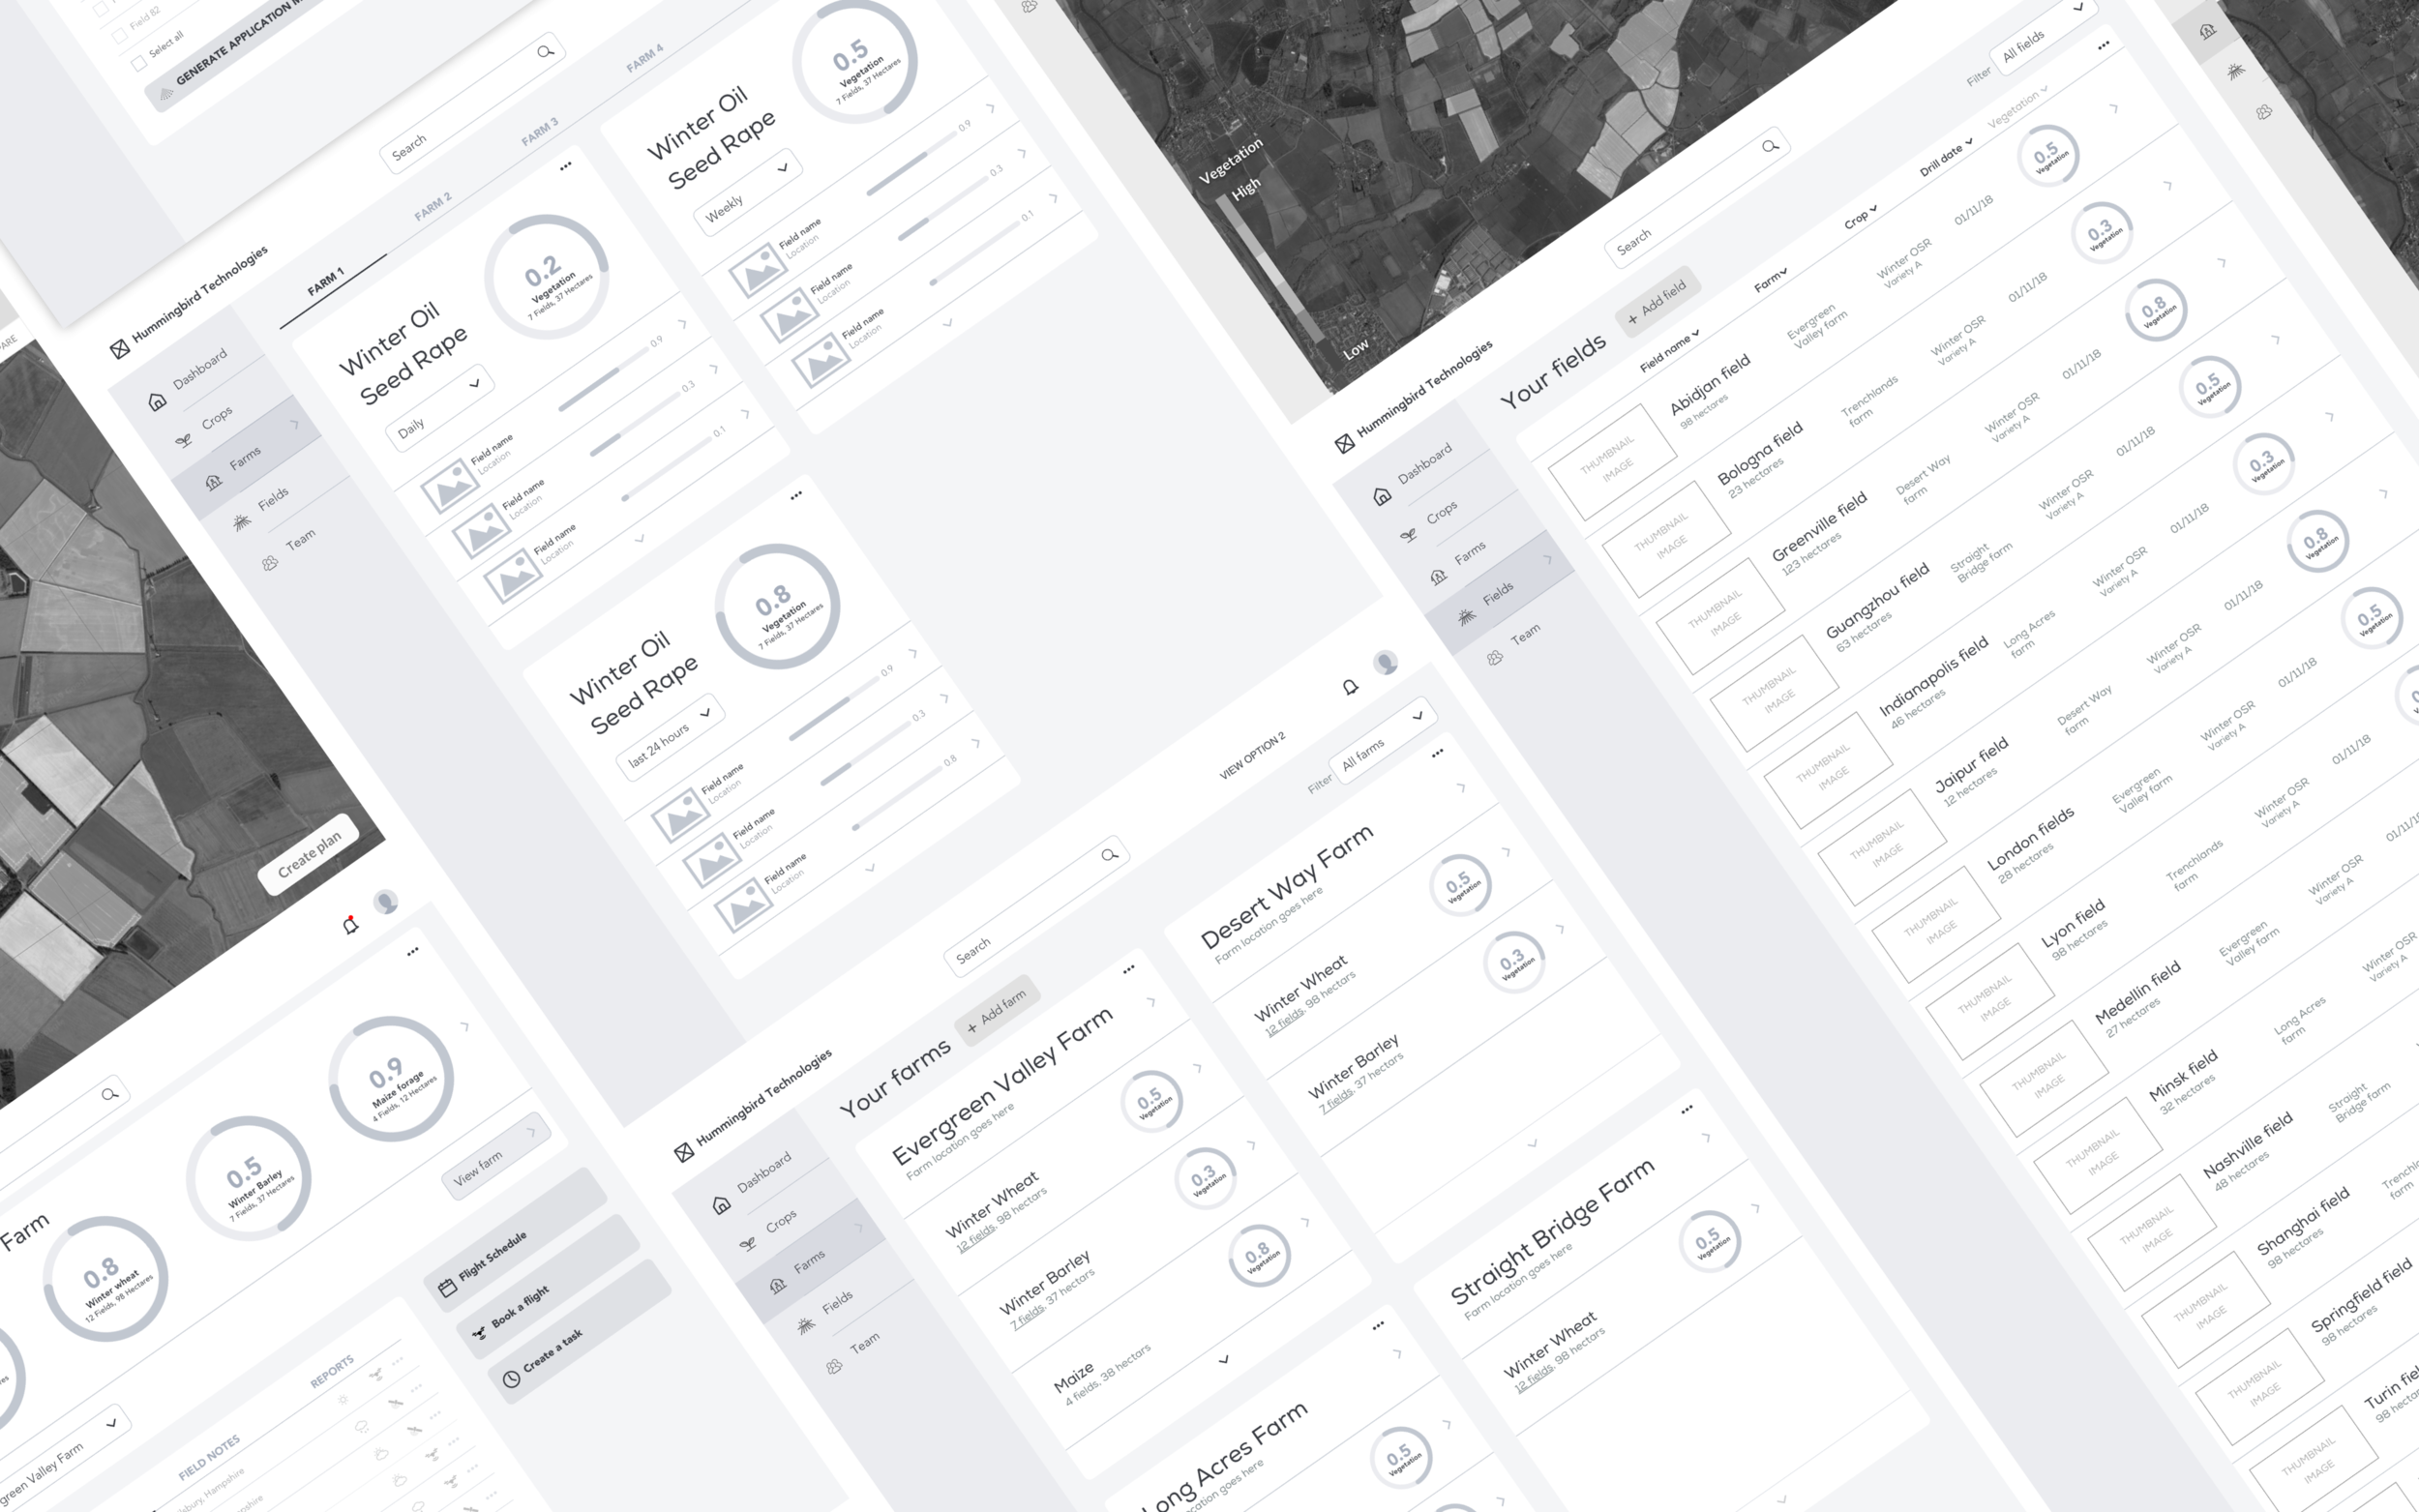
Dashboard Prototypes
Another key user need that was identified through research was the ability to have a dashboard view that summarised crop data across all farms and fields. I iterated and tested multiple variations of a dashboard and subsequent data views. This was tested with internal stakeholders and some real customers.
